

一、Prometheus静态配置出现背景
前面都是使用ServiceMonitor配置监控目标,但有些场景就无法使用ServiceMonitor,比如监控windows外部主机、域名等。另外,假如你没有安装Prometheus Operator,同样无法使用ServiceMonitor。类似以上场景就需要Prometheus静态配置。
二、Prometheus静态配置优点
Prometheus静态配置一般有如下优点:
- 控制:您可以完全控制要监控的目标,包括目标的配置和标签等
- 精确性:静态配置允许您精确地定义要监控的目标,避免了不需要监控的目标被自动发现
三、Prometheus静态配置应用场景
Prometheus静态配置主要应用于以下场景:
- 监控非Kubernetes环境:如果您使用Prometheus监控非Kubernetes环境的服务,可能无法使用ServiceMonitor进行自动发现,这时静态配置是更合适的选择
- 精细控制:对于某些特定的监控需求,可能需要精确控制要监控的目标,以确保监控的准确性和有效性
小结:如果您的环境是Kubernetes集群,并且要监控的服务是部署在Kubernetes中的,推荐使用ServiceMonitor进行动态发现和监控。如果要监控的目标无法通过自动发现或需要更精确的控制,则可以使用Prometheus静态配置。在某些情况下,两者也可以结合使用,以充分发挥各自的优势。
四、Prometheus静态配置示例
下面结合黑盒监控来进行Prometheus静态配置示例:
1.创建一个空文件,然后通过该文件创建一个 Secret,那么这个 Secret 即可作为 Prometheus 的静态配置
[root@k8s-master01 ~]# touch prometheus-additional.yaml
[root@k8s-master01 ~]# kubectl create secret generic additional-configs --from-file=prometheus-additional.yaml -n monitoring
查看 Secret是否创建完成
[root@k8s-master01 ~]# kubectl describe secret additional-configs -n  monitoring
Name:         additional-configs
Namespace:    monitoring
Labels:       <none>
Annotations:  <none>

Type:  Opaque

Data
====
prometheus-additional.yaml:  0 bytes
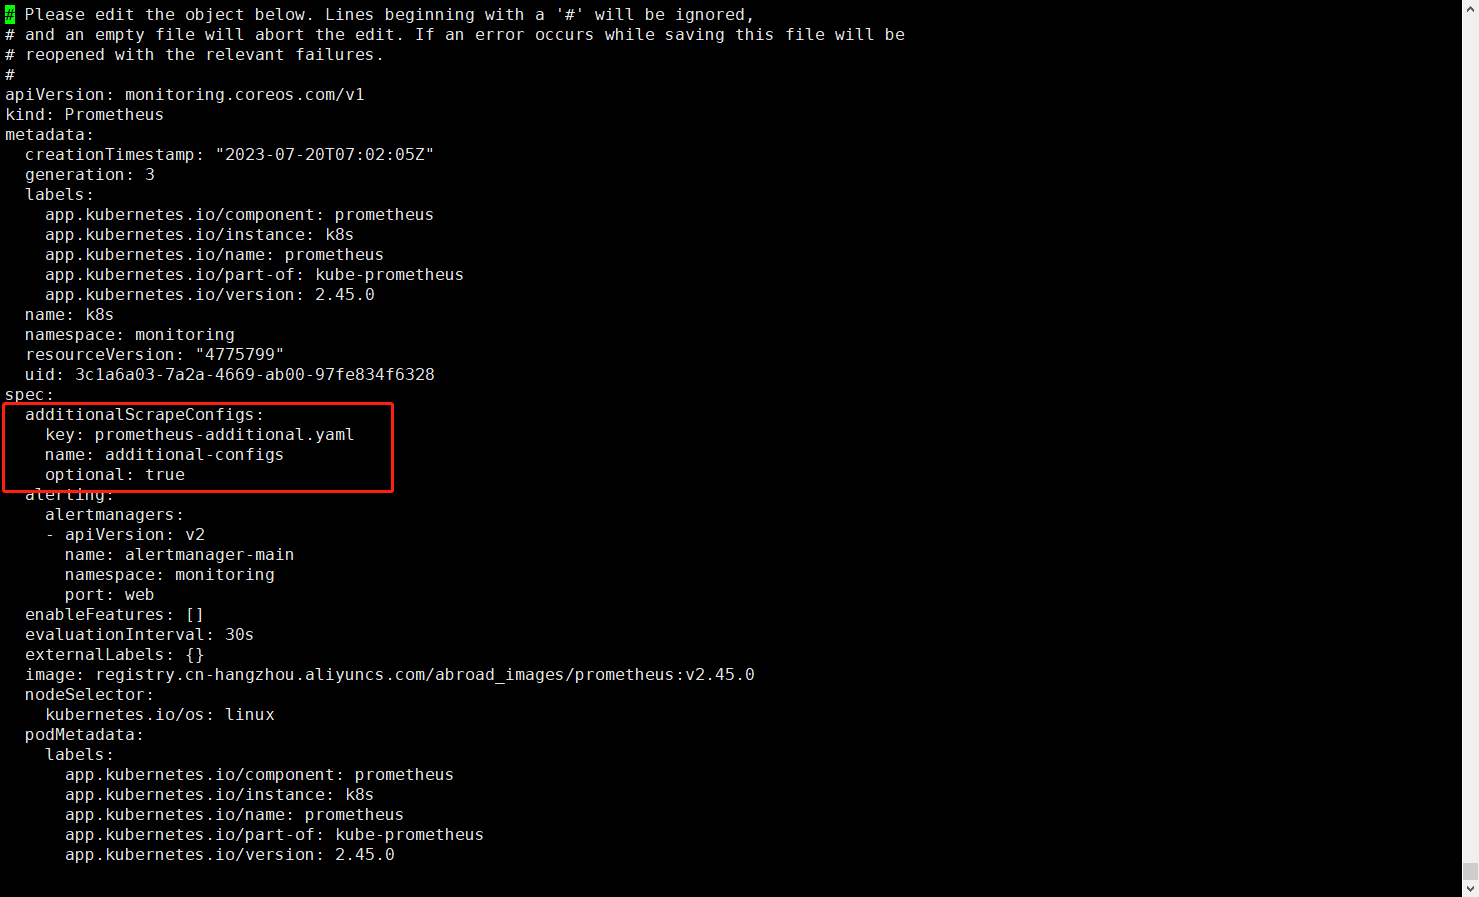
2.创建完 Secret 后,需要编辑下 Prometheus 配置
[root@k8s-master01 ~]# kubectl edit prometheus -n monitoring k8s
...
...
  additionalScrapeConfigs:
    key: prometheus-additional.yaml
    name: additional-configs
    optional: true
...
...
3.参考blackbox_exporter说明,打开prometheus-additional.yaml文件输入以下内容,添加job
[root@k8s-master01 ~]# vim prometheus-additional.yaml
- job_name: 'blackbox'
  metrics_path: /probe
  params:
    module: [http_2xx] # Look for a HTTP 200 response.
  static_configs:
    - targets:
      - https://www.baidu.com # Target to probe with https.
      - https://www.aaa.com # Target to probe with https.
      - http://gaoxin.kubeasy.com
  relabel_configs:
    - source_labels: [__address__]
      target_label: __param_target
    - source_labels: [__param_target]
      target_label: instance
    - target_label: __address__
      replacement: blackbox-exporter:19115 # The blackbox exporter's real hostname:port
通过该文件更新该Secret
[root@k8s-master01 ~]# kubectl create secret generic additional-configs --from-file=prometheus-additional.yaml --dry-run=client -oyaml | kubectl replace -f - -n monitoring
查看Secret是否更新完成
[root@k8s-master01 ~]# kubectl get secret -n monitoring additional-configs -oyaml
apiVersion: v1
data:
  prometheus-additional.yaml: LSBqb2JfbmFtZTogJ2JsYWNrYm94JwogIG1ldHJpY3NfcGF0aDogL3Byb2JlCiAgcGFyYW1zOgogICAgbW9kdWxlOiBbaHR0cF8yeHhdICMgTG9vayBmb3IgYSBIVFRQIDIwMCByZXNwb25zZS4KICBzdGF0aWNfY29uZmlnczoKICAgIC0gdGFyZ2V0czoKICAgICAgLSBodHRwczovL3d3dy5iYWlkdS5jb20gIyBUYXJnZXQgdG8gcHJvYmUgd2l0aCBodHRwcy4KICAgICAgLSBodHRwczovL3d3dy5hYWEuY29tICMgVGFyZ2V0IHRvIHByb2JlIHdpdGggaHR0cHMuCiAgICAgIC0gaHR0cDovL2dhb3hpbi5rdWJlYXN5LmNvbQogIHJlbGFiZWxfY29uZmlnczoKICAgIC0gc291cmNlX2xhYmVsczogW19fYWRkcmVzc19fXQogICAgICB0YXJnZXRfbGFiZWw6IF9fcGFyYW1fdGFyZ2V0CiAgICAtIHNvdXJjZV9sYWJlbHM6IFtfX3BhcmFtX3RhcmdldF0KICAgICAgdGFyZ2V0X2xhYmVsOiBpbnN0YW5jZQogICAgLSB0YXJnZXRfbGFiZWw6IF9fYWRkcmVzc19fCiAgICAgIHJlcGxhY2VtZW50OiBibGFja2JveC1leHBvcnRlcjoxOTExNSAjIFRoZSBibGFja2JveCBleHBvcnRlcidzIHJlYWwgaG9zdG5hbWU6cG9ydAo=
kind: Secret
metadata:
  creationTimestamp: "2023-07-23T10:46:23Z"
  name: additional-configs
  namespace: monitoring
  resourceVersion: "4775796"
  uid: 52eb0212-3df0-4c6b-9cb6-f09e69ed2d05
type: Opaque
对其进行解密验证
[root@k8s-master01 ~]# echo """
> LSBqb2JfbmFtZTogJ2JsYWNrYm94JwogIG1ldHJpY3NfcGF0aDogL3Byb2JlCiAgcGFyYW1zOgogICAgbW9kdWxlOiBbaHR0cF8yeHhdICMgTG9vayBmb3IgYSBIVFRQIDIwMCByZXNwb25zZS4KICBzdGF0aWNfY29uZmlnczoKICAgIC0gdGFyZ2V0czoKICAgICAgLSBodHRwczovL3d3dy5iYWlkdS5jb20gIyBUYXJnZXQgdG8gcHJvYmUgd2l0aCBodHRwcy4KICAgICAgLSBodHRwczovL3d3dy5hYWEuY29tICMgVGFyZ2V0IHRvIHByb2JlIHdpdGggaHR0cHMuCiAgICAgIC0gaHR0cDovL2dhb3hpbi5rdWJlYXN5LmNvbQogIHJlbGFiZWxfY29uZmlnczoKICAgIC0gc291cmNlX2xhYmVsczogW19fYWRkcmVzc19fXQogICAgICB0YXJnZXRfbGFiZWw6IF9fcGFyYW1fdGFyZ2V0CiAgICAtIHNvdXJjZV9sYWJlbHM6IFtfX3BhcmFtX3RhcmdldF0KICAgICAgdGFyZ2V0X2xhYmVsOiBpbnN0YW5jZQogICAgLSB0YXJnZXRfbGFiZWw6IF9fYWRkcmVzc19fCiAgICAgIHJlcGxhY2VtZW50OiBibGFja2JveC1leHBvcnRlcjoxOTExNSAjIFRoZSBibGFja2JveCBleHBvcnRlcidzIHJlYWwgaG9zdG5hbWU6cG9ydAo="""|base64 -d
- job_name: 'blackbox'
  metrics_path: /probe
  params:
    module: [http_2xx] # Look for a HTTP 200 response.
  static_configs:
    - targets:
      - https://www.baidu.com # Target to probe with https.
      - https://www.aaa.com # Target to probe with https.
      - http://gaoxin.kubeasy.com
  relabel_configs:
    - source_labels: [__address__]
      target_label: __param_target
    - source_labels: [__param_target]
      target_label: instance
    - target_label: __address__
      replacement: blackbox-exporter:19115 # The blackbox exporter's real hostname:port
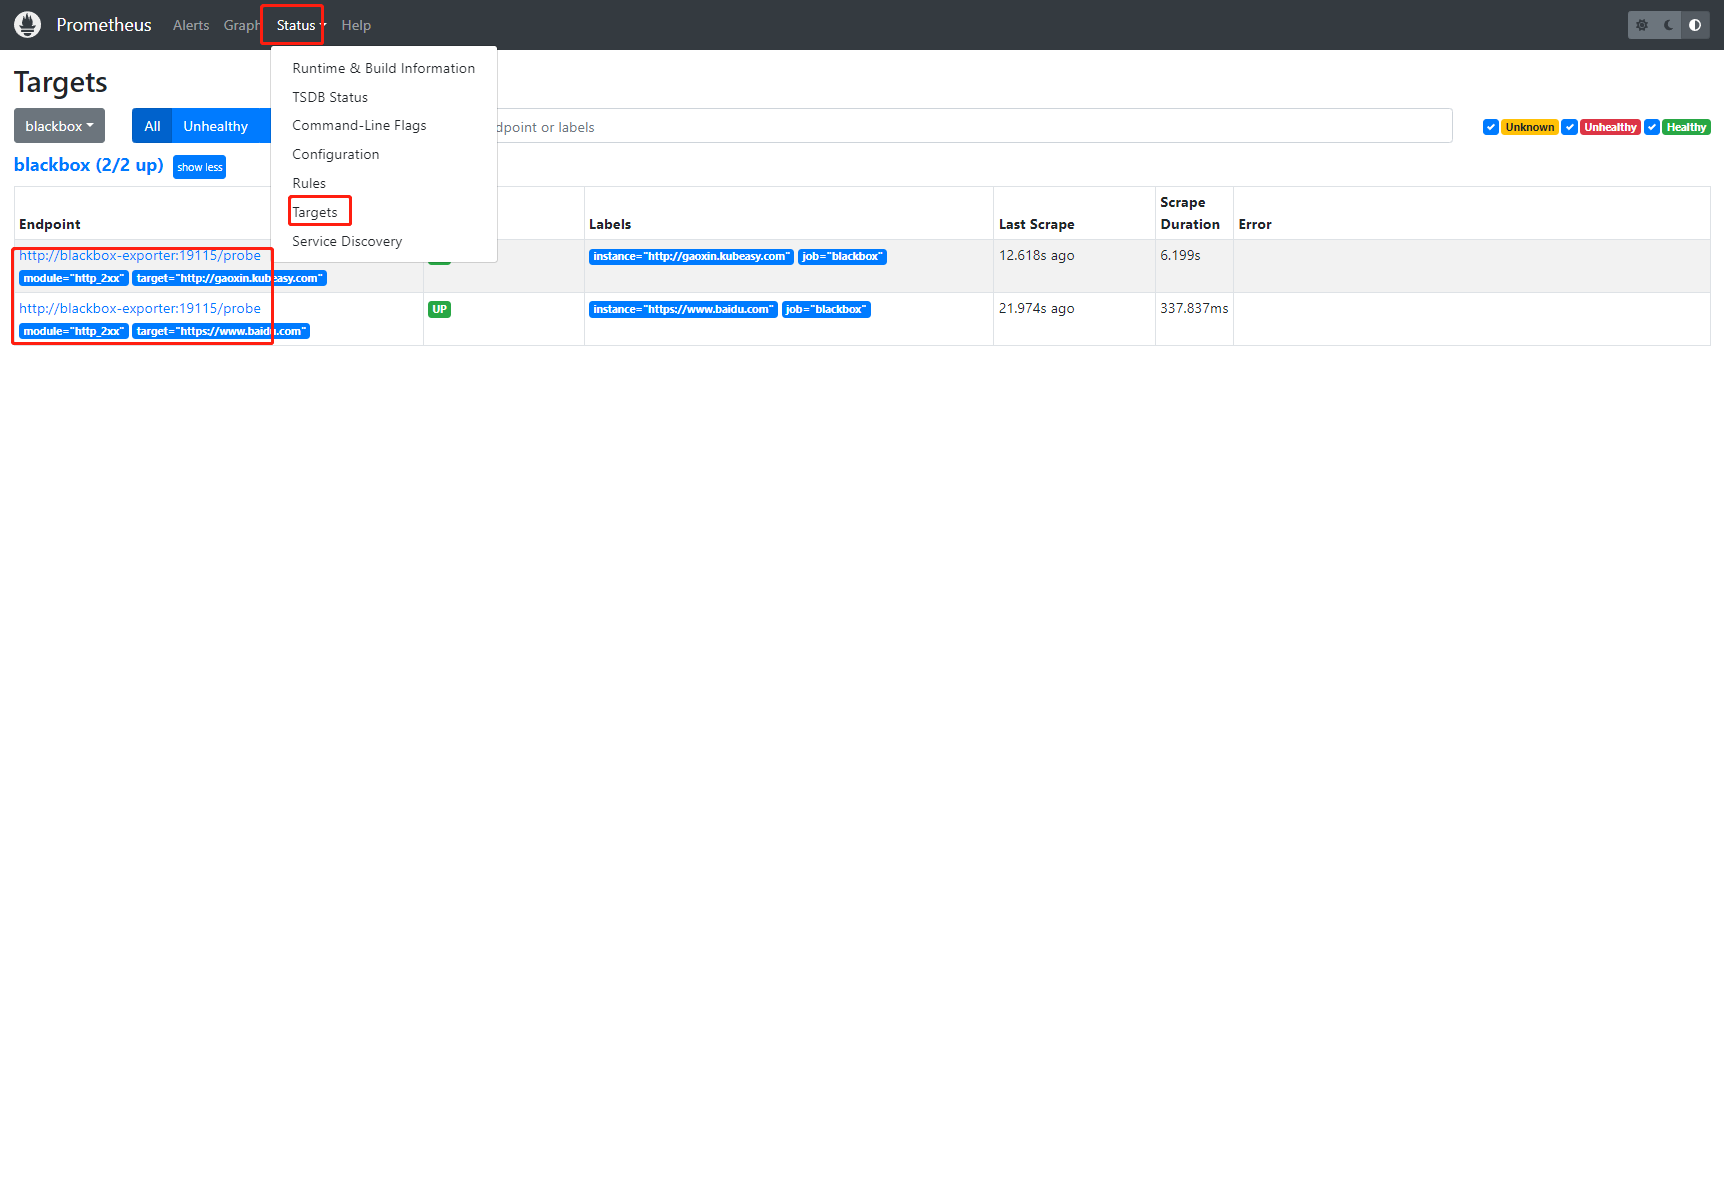
4.登录Prometheus页面验证
获取Prometheus服务NodePort端口
[root@k8s-master01 ~]# kubectl get svc -n monitoring | grep prometheus-k8s
prometheus-k8s          NodePort    10.0.110.215   <none>        9090:30186/TCP,8080:31400/TCP   2d2h
打开浏览器输入节点IP:30186后,依次点击【Status】-【Targets】后,观察到blackbox已被监控,且Endpoint状态都为UP
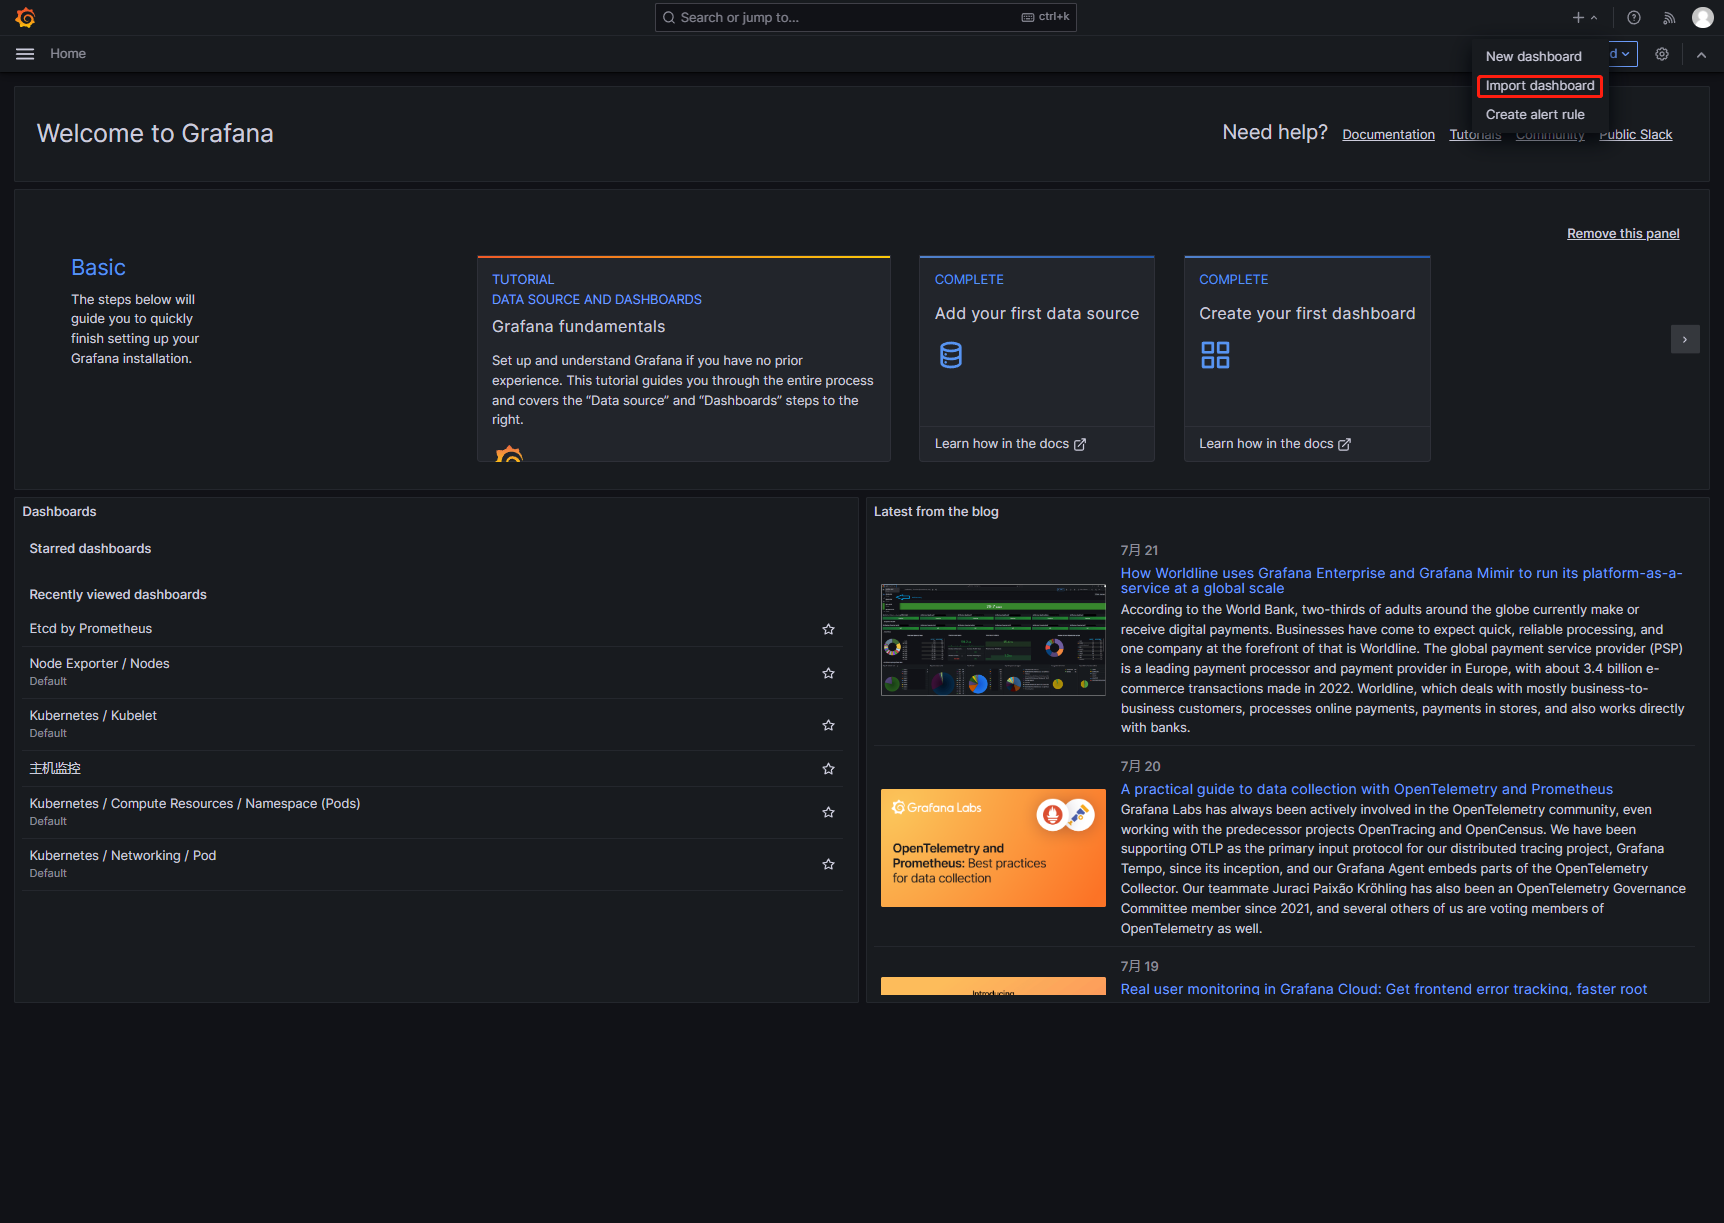
5.登录Grafana页面验证
获取Grafana服务NodePort端口
[root@k8s-master01 ~]# kubectl get svc -n monitoring | grep grafana
grafana                 NodePort    10.0.14.56     <none>        3000:30428/TCP                  2d3h
打开浏览器输入节点IP:30428后,依次点击【+】-【import dashboard】
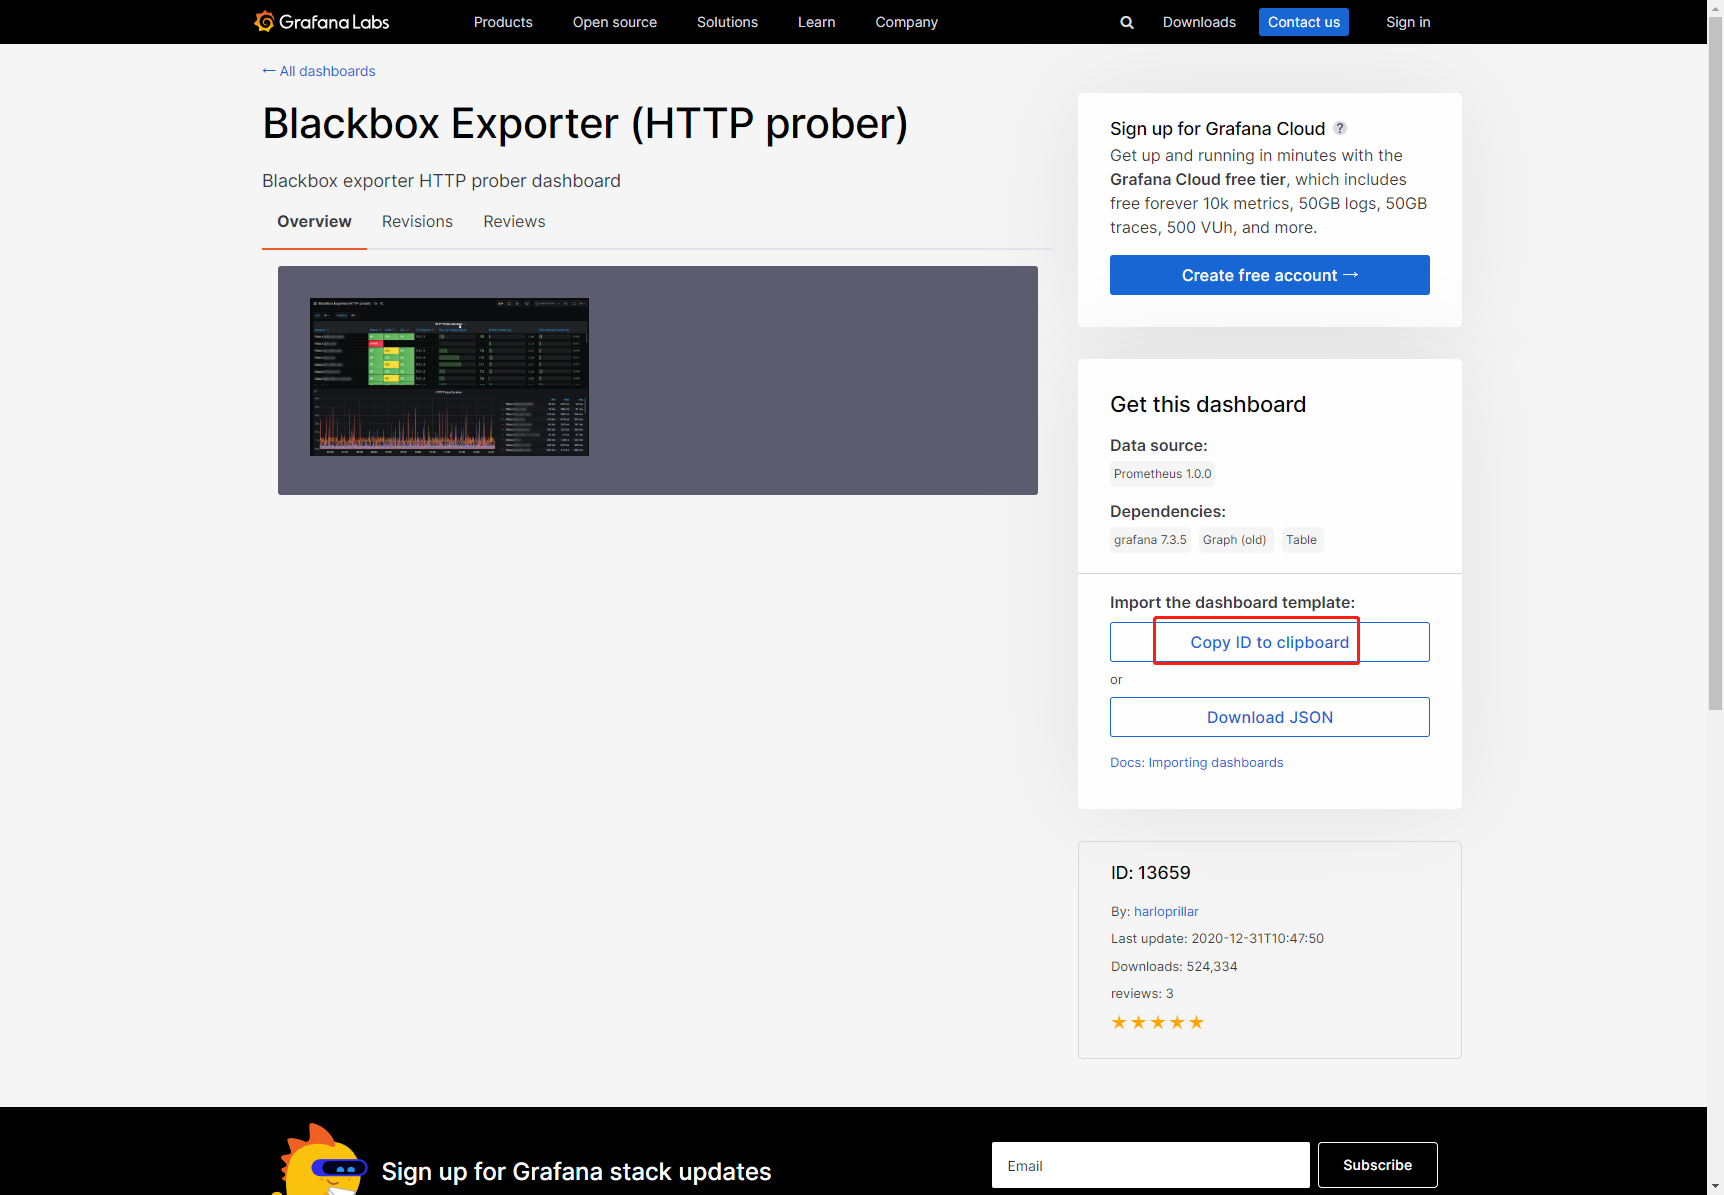
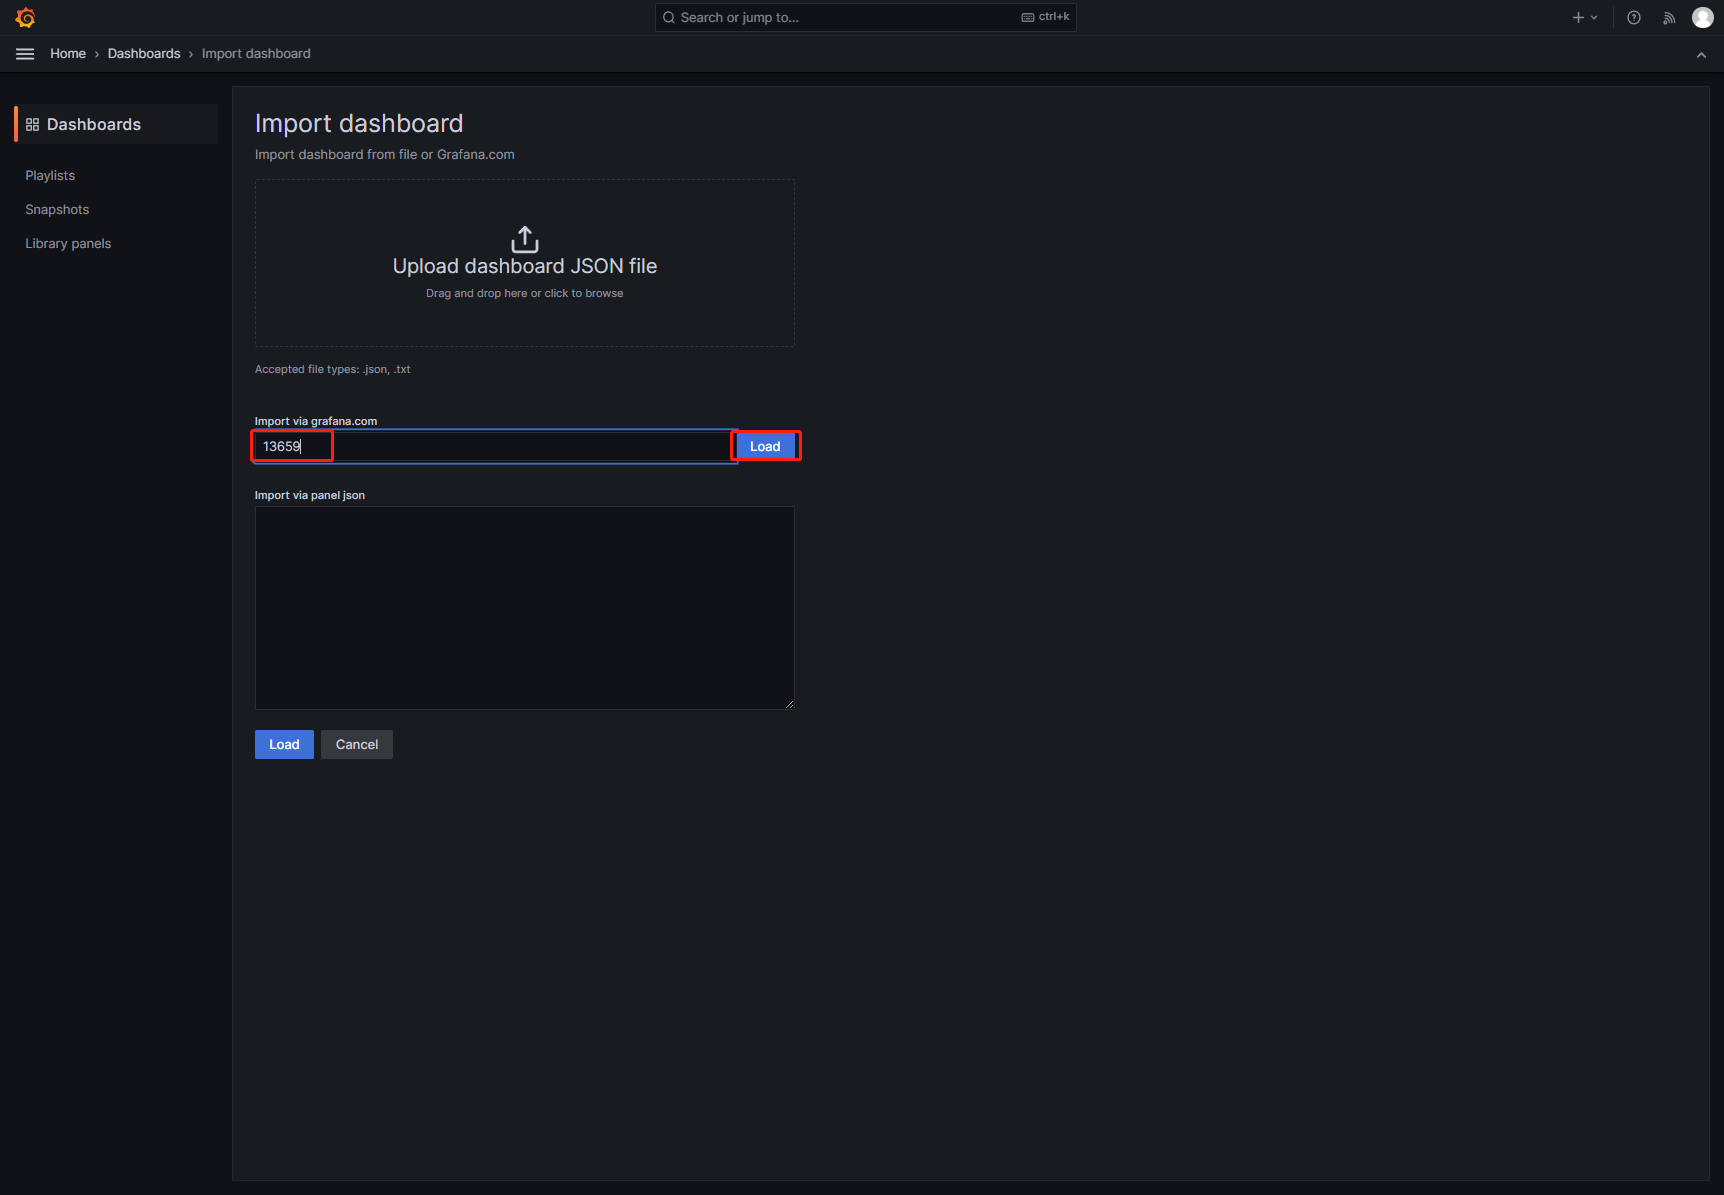
你可以登录grafana官网下载自己心仪的模板,选择好后复制【Dashboard ID】
回到grafana界面,填写刚刚复制的【Dashboard ID】后,点击【Load】
填写【Name】并选择监控来源(prometheus)后,点击【Import】
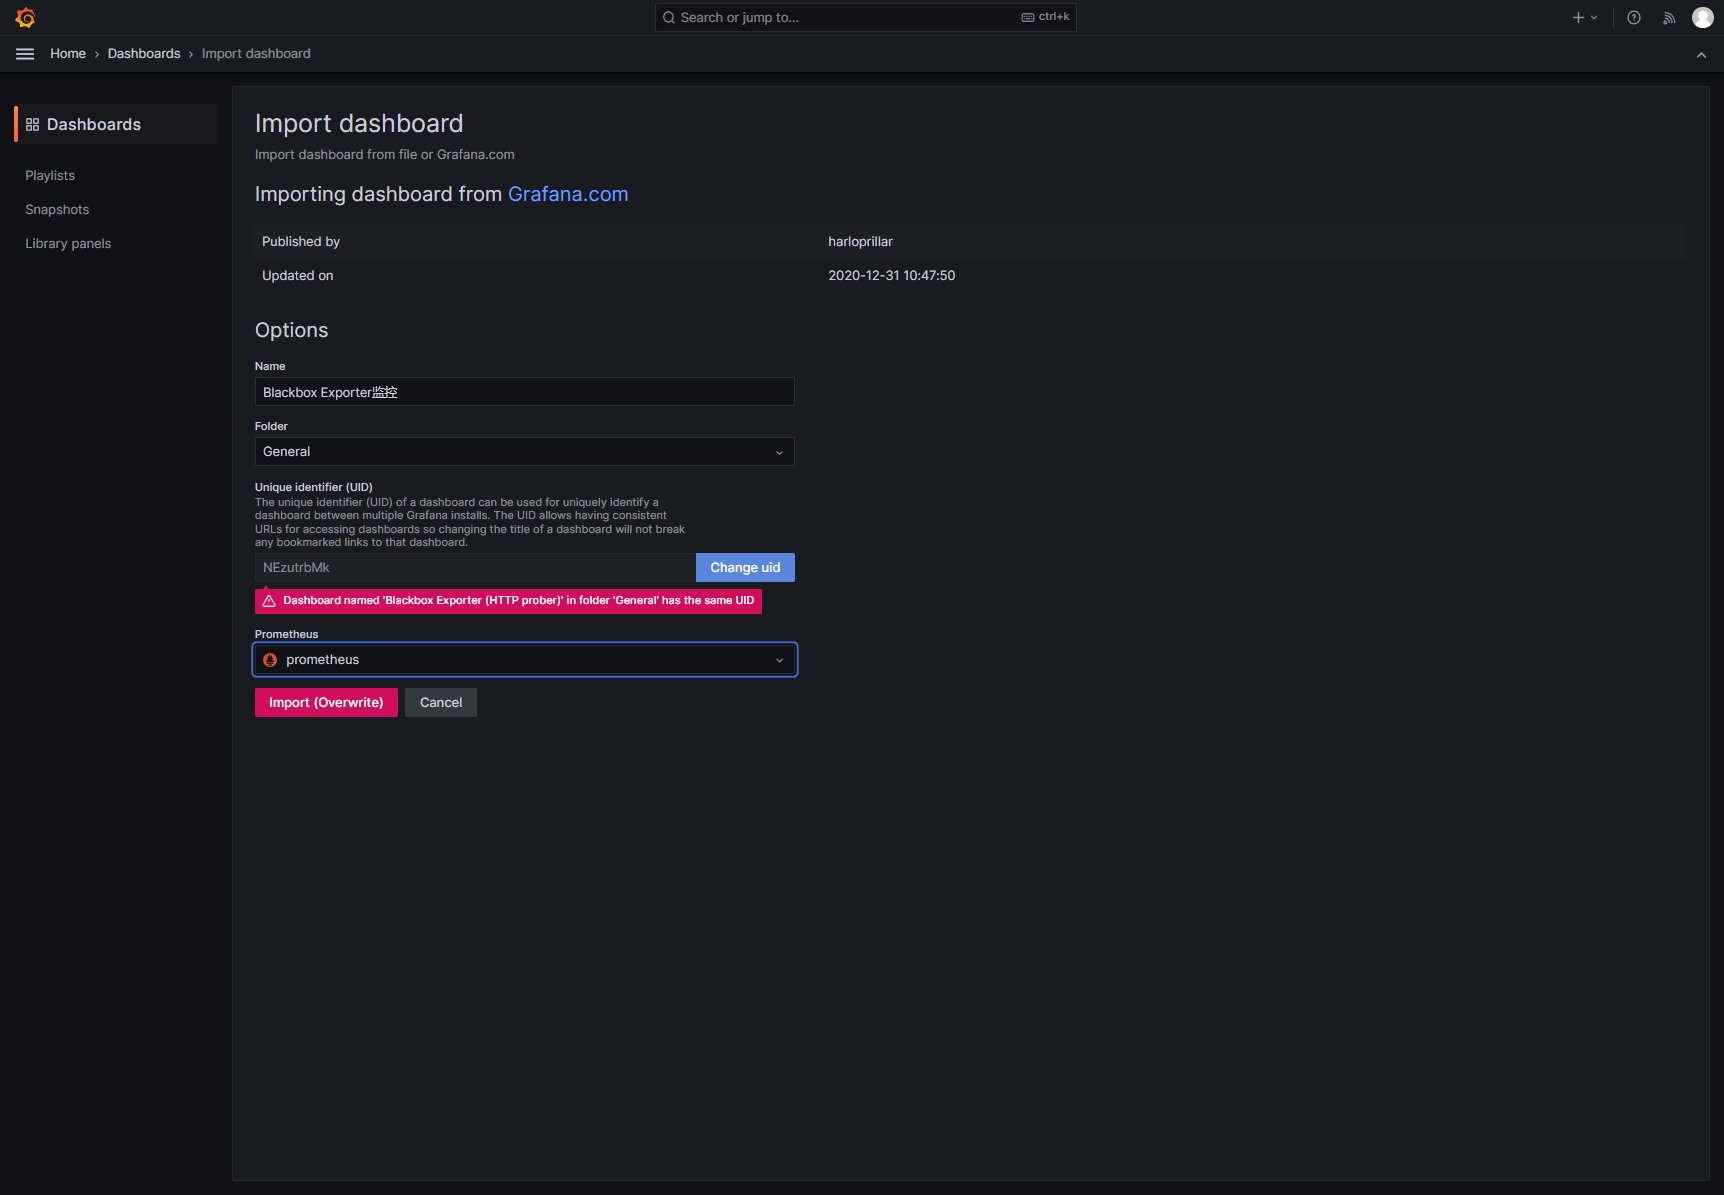
说明:我这里已经导入过了,所以才会显示上面提示信息
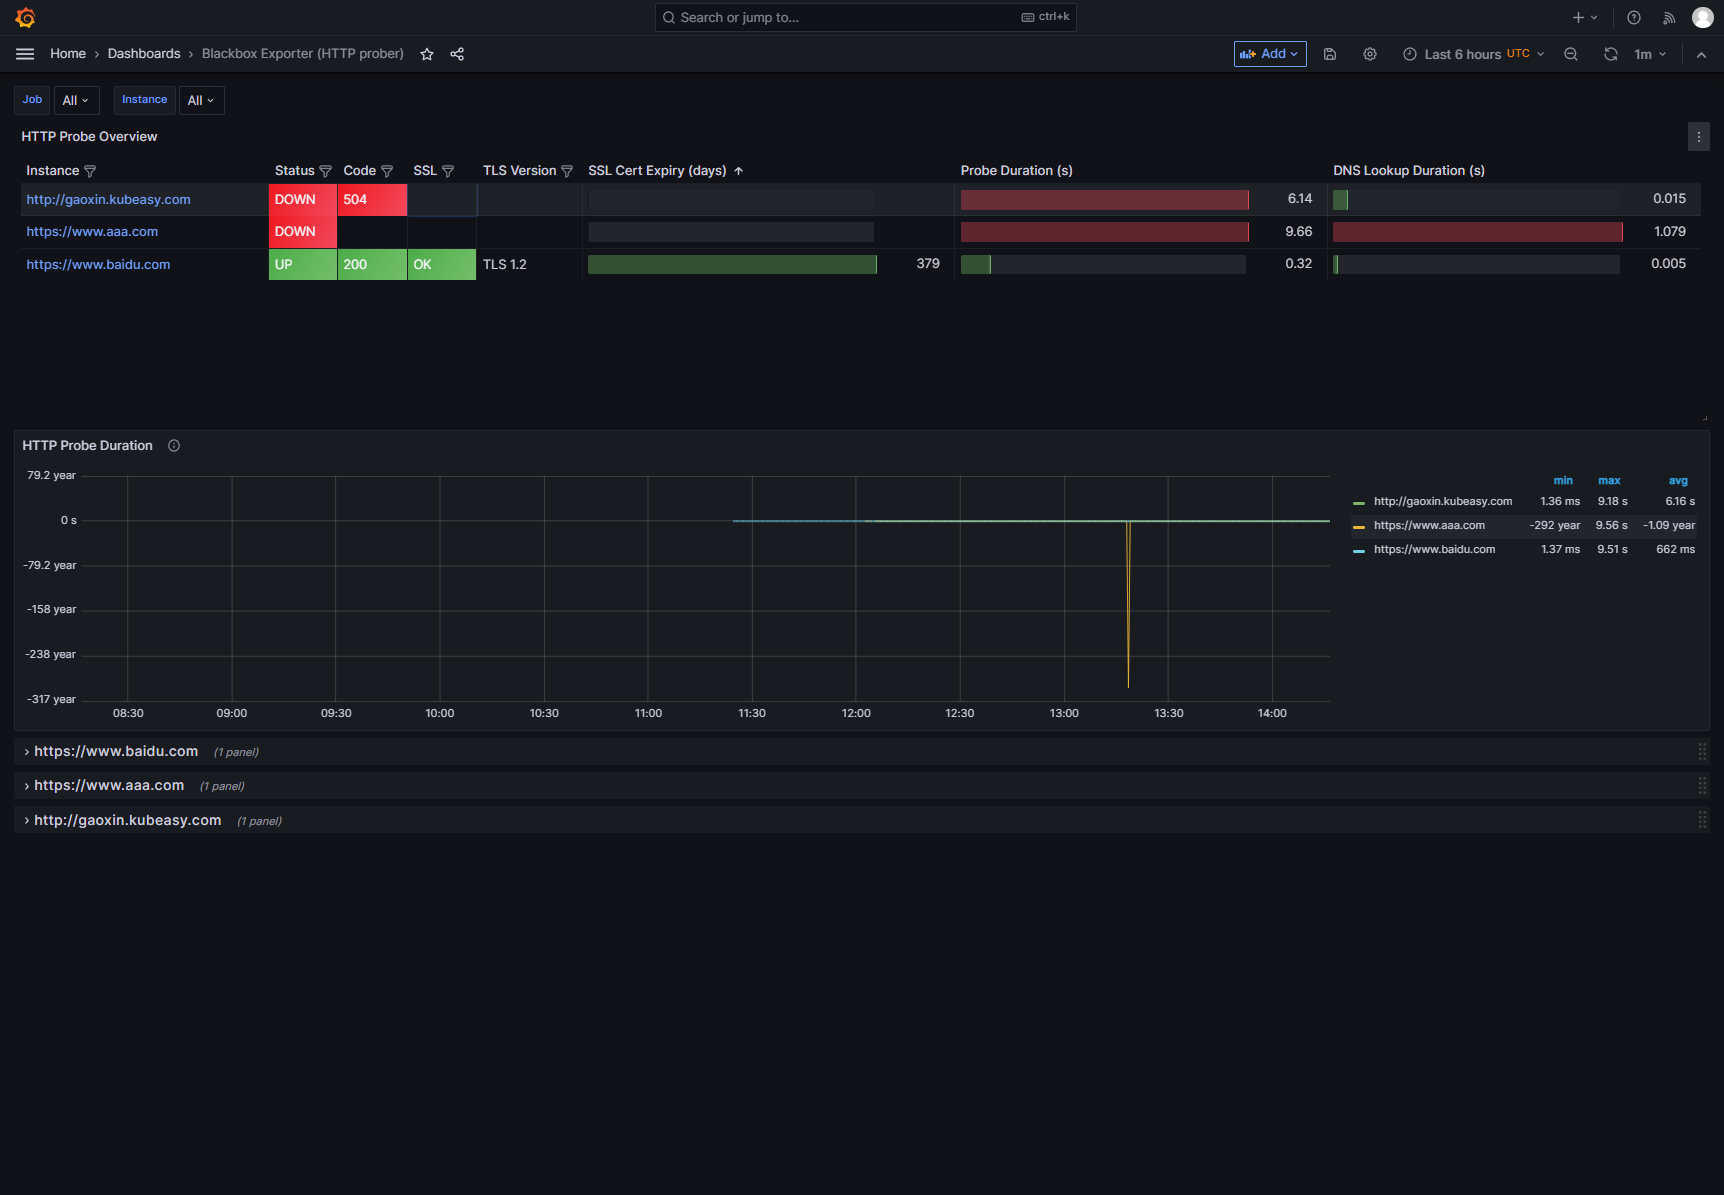
这样就可以观察到域名监控情况了
6.如果你想添加新的域名,需要修改prometheus-additional.yaml文件
[root@k8s-master01 ~]# vim prometheus-additional.yaml
- job_name: 'blackbox'
  metrics_path: /probe
  params:
    module: [http_2xx] # Look for a HTTP 200 response.
  static_configs:
    - targets:
      - https://www.baidu.com # Target to probe with https.
      - https://www.aaa.com # Target to probe with https.
      - http://gaoxin.kubeasy.com
  relabel_configs:
    - source_labels: [__address__]
      target_label: __param_target
    - source_labels: [__param_target]
      target_label: instance
    - target_label: __address__
      replacement: blackbox-exporter:19115 # The blackbox exporter's real hostname:port
修改完成进行更新,更新完成后就可以去登录Grafana页面验证查看了
[root@k8s-master01 ~]# kubectl create secret generic additional-configs --from-file=prometheus-additional.yaml --dry-run=client -oyaml | kubectl replace -f - -n monitoring