
一、使用 Operator 部署 Istio
1.点击Istio官网,查看Istio和k8s版本之间的对应关系
| 版本 | 目前支持 | 发布日期 | 生命尽头 | 支持的 Kubernetes 版本 | 已测试,但不支持 |
|---|---|---|---|---|---|
| 掌握 | 不,仅开发 | 1.24、1.25、1.26、1.27 | 1.20、1.21、1.22、1.23 | ||
| 1.18 | 是的 | 2023 年 6 月 3 日 | ~2023 年 12 月(预计) | 1.24、1.25、1.26、1.27 | 1.20、1.21、1.22、1.23 |
| 1.17 | 是的 | 2023 年 2 月 14 日 | ~2023 年 9 月(预计) | 1.23、1.24、1.25、1.26 | 1.16、1.17、1.18、1.19、1.20、1.21、1.22 |
| 1.16 | 不 | 2022 年 11 月 15 日 | 2023 年 7 月 25 日 | 1.22、1.23、1.24、1.25 | 1.16、1.17、1.18、1.19、1.20、1.21 |
| 1.15 | 不 | 2022 年 8 月 31 日 | 2023 年 4 月 4 日 | 1.22、1.23、1.24、1.25 | 1.16、1.17、1.18、1.19、1.20、1.21 |
| 1.14 | 不 | 2022 年 5 月 24 日 | 2022 年 12 月 27 日 | 1.21、1.22、1.23、1.24 | 1.16、1.17、1.18、1.19、1.20 |
| 1.13 | 不 | 2022 年 2 月 11 日 | 2022 年 10 月 12 日 | 1.20、1.21、1.22、1.23 | 1.16、1.17、1.18、1.19 |
因为我的k8s版本为1.23.17,所以这里选择安装1.16.0版本的 Istio
[root@k8s-master01 ~]# kubectl get node
NAME           STATUS   ROLES    AGE    VERSION
k8s-master01   Ready    <none>   147d   v1.23.17
k8s-master02   Ready    <none>   147d   v1.23.17
k8s-master03   Ready    <none>   147d   v1.23.17
k8s-node01     Ready    <none>   147d   v1.23.17
k8s-node02     Ready    <none>   147d   v1.23.17
2.下载1.16.0版本 Istio 的安装包
[root@k8s-master01 ~]# wget https://github.com/istio/istio/releases/download/1.16.0/istio-1.16.0-linux-amd64.tar.gz
如果下载不下来的话,可以在浏览器上输入https://github.com/istio/istio/releases/download/1.16.0/istio-1.16.0-linux-amd64.tar.gz进行直接下载
3.解压后,将 Istio 的客户端工具 istioctl,移动到/usr/local/bin 目录下
[root@k8s-master01 ~]# tar xf istio-1.16.0-linux-amd64.tar.gz
[root@k8s-master01 ~]# cd istio-1.16.0
[root@k8s-master01 istio-1.16.0]# mv bin/istioctl /usr/local/bin/
[root@k8s-master01 istio-1.16.0]# istioctl version
no running Istio pods in "istio-system"
1.16.0
4.使用 istioctl 一键部署Istio的Operator
[root@k8s-master01 ~]# cd istio-1.16.0/samples
[root@k8s-master01 samples]# istioctl operator init
Operator controller is already installed in istio-operator namespace.
Upgrading operator controller in namespace: istio-operator using image: docker.io/istio/operator:1.16.0
Operator controller will watch namespaces: istio-system
✔ Istio operator installed
✔ Installation complete
查看Pod是否正常启动完成,观察到已成功启动
[root@k8s-master01 istio-1.16.0]# kubectl get po -n istio-operator
NAME                              READY   STATUS    RESTARTS   AGE
istio-operator-798dd58956-xgdx4   1/1     Running   0          3m15s
5.定义 IstioOperator 资源,在 Kubernetes 中安装 Istio
[root@k8s-master01 ~]# cd istio-1.16.0
[root@k8s-master01 istio-1.16.0]# vim istio-operator.yaml
apiVersion: install.istio.io/v1alpha1
kind: IstioOperator
metadata:
  namespace: istio-system
  name: example-istiocontrolplane
spec:
  profile: default
  components: # 自定义组件配置
    ingressGateways: # 自定义 ingressGateway 配置
      - name: istio-ingressgateway
        enabled: true # 开启 ingressGateway
        k8s: # 自定义 ingressGateway 的 Kubernetes 配置
          service: #将 Service 类型改成 NodePort
            type: NodePort
            ports:
            - port: 15020
              nodePort: 30520
              name: status-port
            - port: 80 # 流量入口 80 端口映射到 NodePort 的 30080,之后通过节点IP+30080 即可访问 Istio 服务
              nodePort: 30080
              name: http2
              targetPort: 8080
            - port: 443
              nodePort: 30443
              name: https
              targetPort: 8443
安装 Istio
[root@k8s-master01 istio-1.16.0]# istioctl manifest apply -f istio-operator.yaml
This will install the Istio 1.16.0 default profile with ["Istio core" "Istiod" "Ingress gateways"] components into the cluster. Proceed? (y/N) y
✔ Istio core installed
✔ Istiod installed
✔ Ingress gateways installed
✔ Installation complete                                                                                                                                        Making this installation the default for injection and validation.
查看创建的 Service 和 Pod
[root@k8s-master01 istio-1.16.0]#  kubectl get svc,po -n istio-system
NAME                           TYPE        CLUSTER-IP   EXTERNAL-IP   PORT(S)                                      AGE
service/istio-ingressgateway   NodePort    10.0.2.34    <none>        15020:30520/TCP,80:30080/TCP,443:30443/TCP   2m59s
service/istiod                 ClusterIP   10.0.247.2   <none>        15010/TCP,15012/TCP,443/TCP,15014/TCP        4m52s

NAME                                       READY   STATUS    RESTARTS   AGE
pod/istio-ingressgateway-57555859c-hb6ch   1/1     Running   0          3m
pod/istiod-77674d8584-9jk9h                1/1     Running   0          4m52s
二、配置自动注入
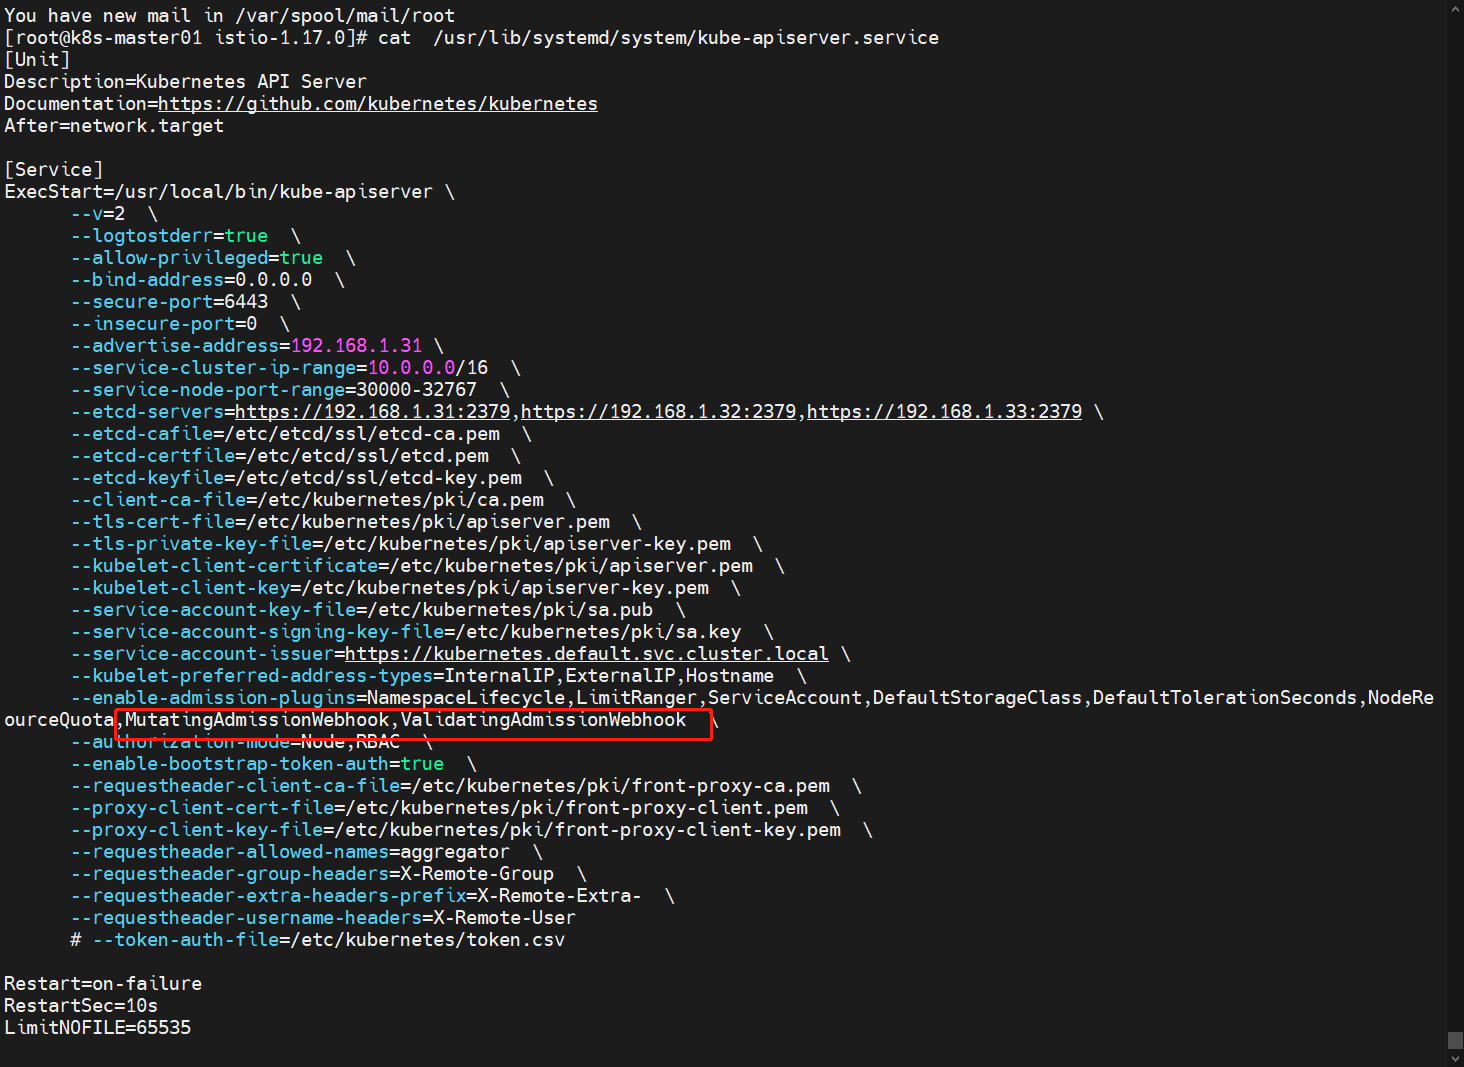
1.修改 APIServer 的配置文件,添加 MutatingAdmissionWebhook,ValidatingAdmissionWebhook (如果 K8s 版本大于 1.16 默认已经开启)
[root@k8s-master01 ~]# vim /usr/lib/systemd/system/kube-apiserver.service
...
...
      --enable-admission-plugins=NamespaceLifecycle,LimitRanger,ServiceAccount,DefaultStorageClass,DefaultTolerationSeconds,NodeRestriction,ResourceQuota,MutatingAdmissionWebhook,ValidatingAdmissionWebhook
...
...
说明:上面配置文件路径是二进制安装的,如果kubeadm安装的,配置文件路径可能在 /etc/kubernetes/manifests/kube-apiserver.yaml
2.创建一个测试的 Namespace,并添加一个 istio-injection=enabled 的标签
[root@k8s-master01 ~]# kubectl create ns istio-test
[root@k8s-master01 ~]# kubectl label namespace istio-test istio-injection=enabled
3.创建测试应用,此时创建的 Pod 会被自动注入一个 istio-proxy容器
[root@k8s-master01 ~]# cd istio-1.16.0
[root@k8s-master01 istio-1.16.0]# kubectl apply -f samples/sleep/sleep.yaml -n istio-test
查看部署的容器
[root@k8s-master01 istio-1.16.0]#  kubectl get po -n istio-test
NAME                     READY   STATUS    RESTARTS   AGE
sleep-75bbc86479-c7xtv   2/2     Running   0          13m
三、安装可视化工具 Kiali
Kiali 为 Istio 提供了可视化的界面,可以在 Kiali 上进行观测流量的走向、调用链,同时还可 以使用 Kiali 进行配置管理。
1.进入到 Istio 的安装包目录安装Kiali
[root@k8s-master01 ~]# cd istio-1.16.0
[root@k8s-master01 istio-1.16.0]#  kubectl create -f samples/addons/kiali.yaml
查看部署状态
[root@k8s-master01 istio-1.16.0]#  kubectl get po,svc -n istio-system -l app=kiali
NAME                         READY   STATUS    RESTARTS   AGE
pod/kiali-689fbdb586-vbr8s   1/1     Running   0          15m

NAME            TYPE        CLUSTER-IP     EXTERNAL-IP   PORT(S)              AGE
service/kiali   ClusterIP   10.0.160.103   <none>        20001/TCP,9090/TCP   15m
2.将 Service 类型改成 NodePort后访问 Kiali 服务
[root@k8s-master01 istio-1.16.0]# kubectl get svc -n istio-system
NAME                   TYPE        CLUSTER-IP     EXTERNAL-IP   PORT(S)                                      AGE
istio-ingressgateway   NodePort    10.0.26.1      <none>        15020:30520/TCP,80:30080/TCP,443:30443/TCP   38m
istiod                 ClusterIP   10.0.149.172   <none>        15010/TCP,15012/TCP,443/TCP,15014/TCP        42m
kiali                  ClusterIP   10.0.160.103   <none>        20001/TCP,9090/TCP                           18m

[root@k8s-master01 istio-1.16.0]# kubectl edit svc kiali -n istio-system
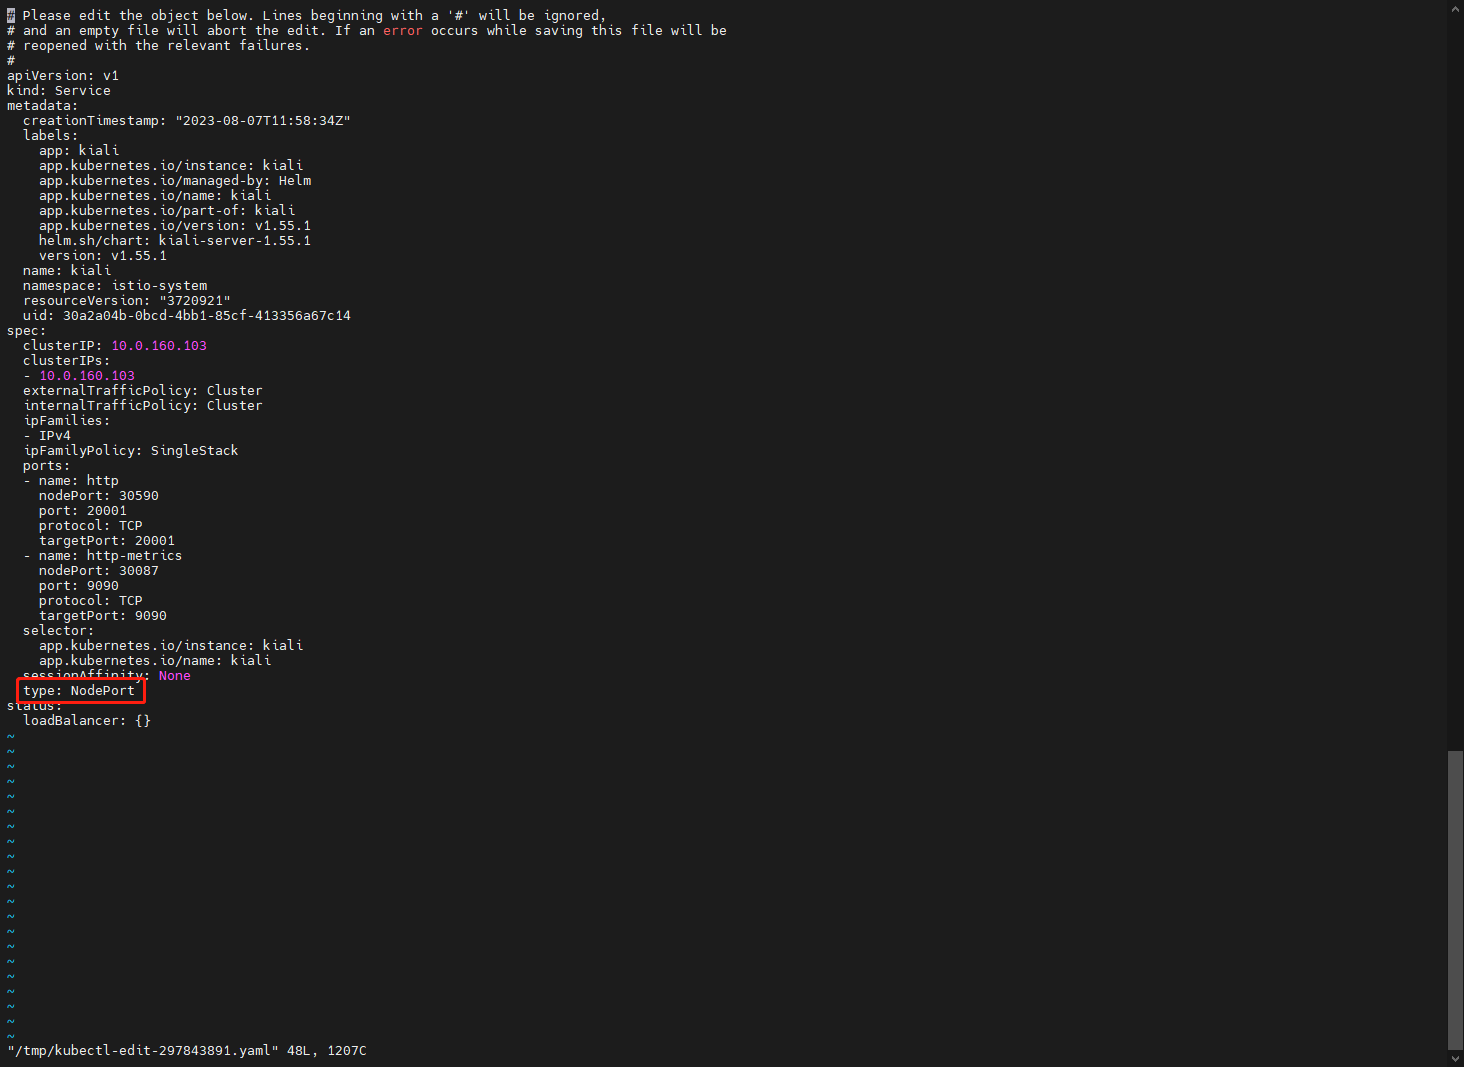
获取对外开放的端口,观察到为30590
[root@k8s-master01 istio-1.16.0]# kubectl get svc -n istio-system
NAME                   TYPE        CLUSTER-IP     EXTERNAL-IP   PORT(S)                                      AGE
istio-ingressgateway   NodePort    10.0.26.1      <none>        15020:30520/TCP,80:30080/TCP,443:30443/TCP   41m
istiod                 ClusterIP   10.0.149.172   <none>        15010/TCP,15012/TCP,443/TCP,15014/TCP        44m
kiali                  NodePort    10.0.160.103   <none>        20001:30590/TCP,9090:30087/TCP               21m
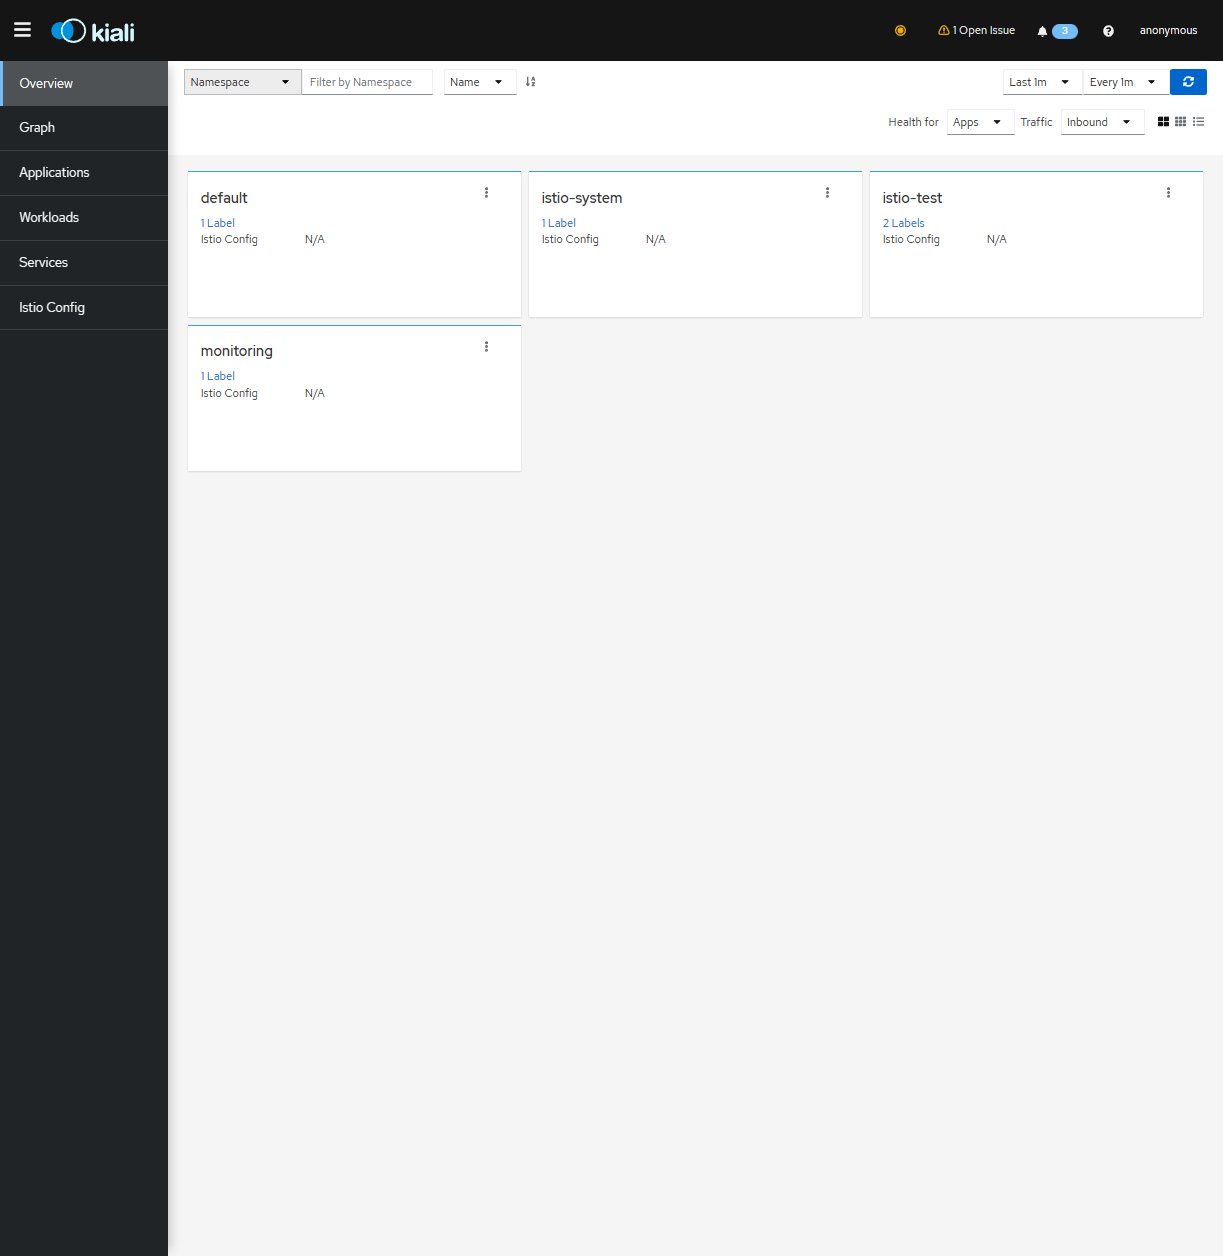
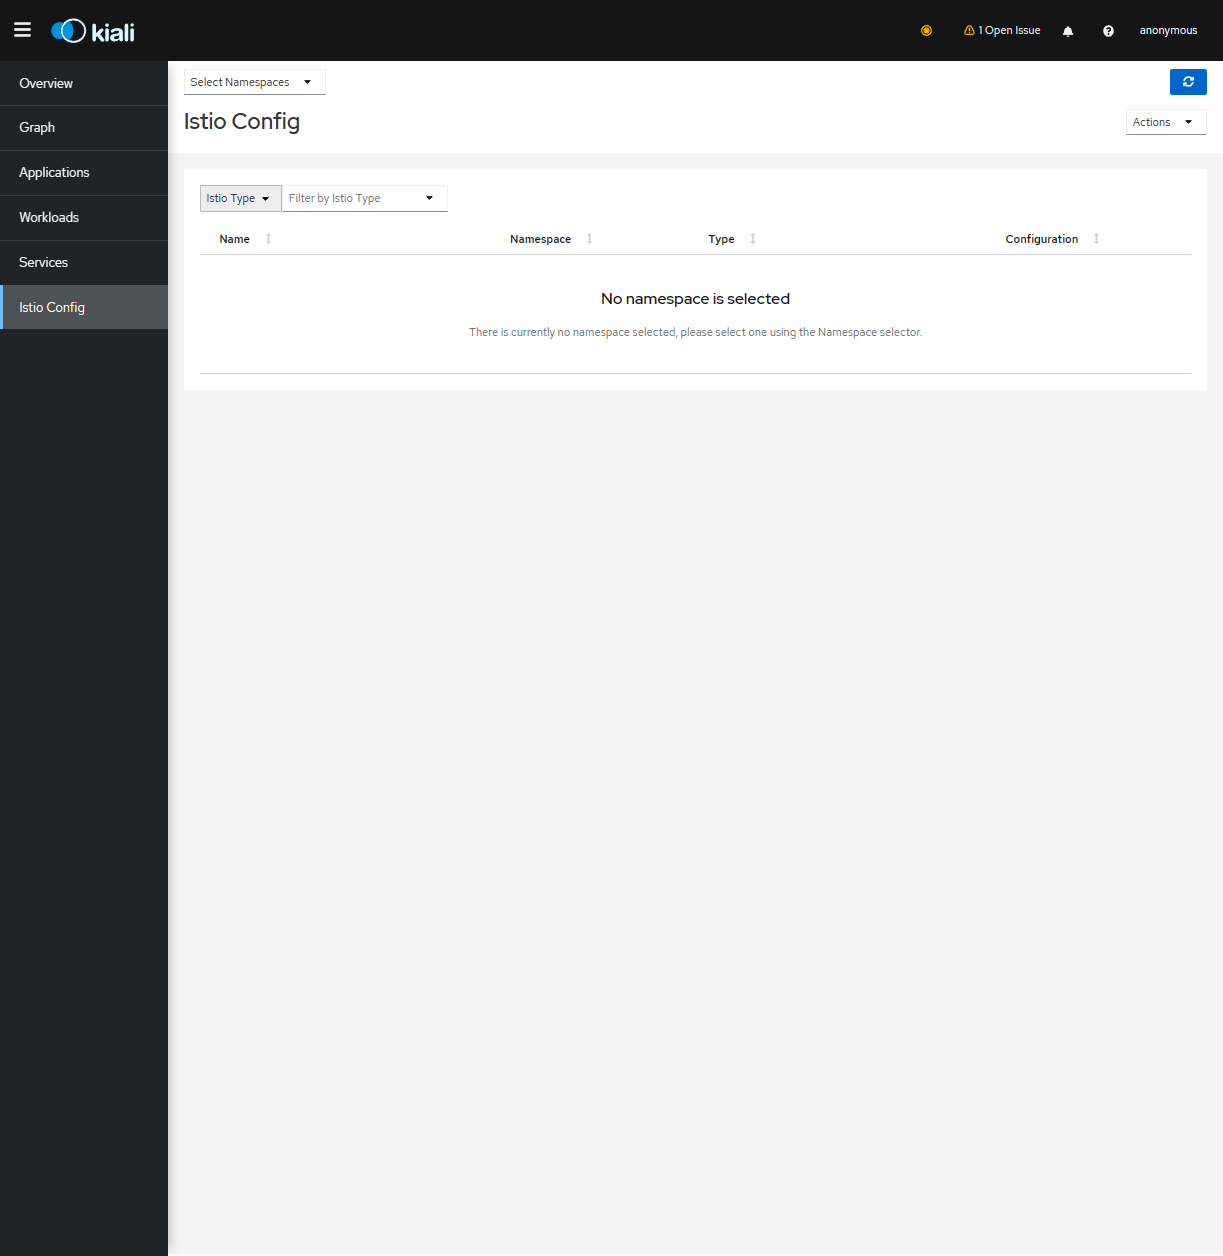
打开浏览器输入Node IP +30590进行访问 Kiali 服务
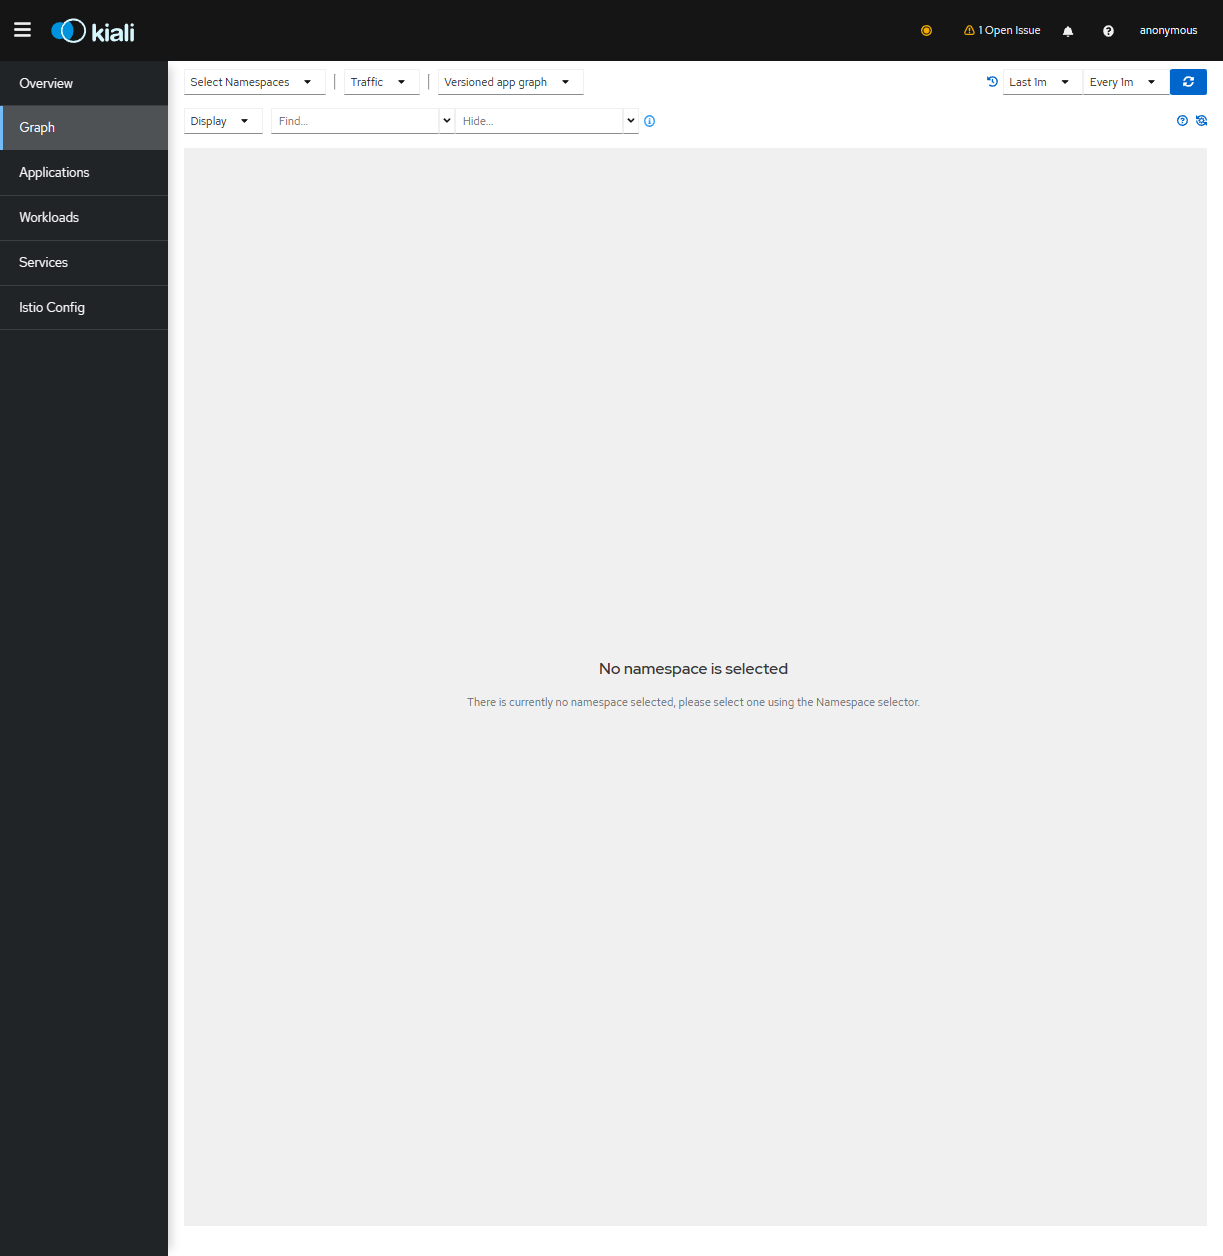
点击【Graph】,在 Graph 页面可以看到应用的流量等信息,此时没有应用,无法看到具体的流量信息
点击【Istio Config】 可以看到当前的 Istio 配置,可以查看配置详情以及更新配置,此时没有应用,无法看到具体的配置信息
3.除了 Kiali 之外,还需要一个链路追踪的工具,安装该工具可以在 Kiali 的 Workloads 页面, 查看某个服务的 Traces 信息。直接安装即可:
[root@k8s-master01 ~]# cd istio-1.16.0
[root@k8s-master01 istio-1.16.0]# kubectl create -f samples/addons/jaeger.yaml
查询容器和服务状态
[root@k8s-master01 istio-1.16.0]# kubectl get pod,svc -n istio-system
NAME                                        READY   STATUS    RESTARTS   AGE
pod/istio-ingressgateway-868f5445cf-ztvcv   1/1     Running   0          57m
pod/istiod-6b56cffbd9-44fk9                 1/1     Running   0          61m
pod/jaeger-54b7b57547-vhjhl                 1/1     Running   0          7m9s
pod/kiali-689fbdb586-vbr8s                  1/1     Running   0          37m

NAME                           TYPE        CLUSTER-IP     EXTERNAL-IP   PORT(S)                                      AGE
service/istio-ingressgateway   NodePort    10.0.26.1      <none>        15020:30520/TCP,80:30080/TCP,443:30443/TCP   57m
service/istiod                 ClusterIP   10.0.149.172   <none>        15010/TCP,15012/TCP,443/TCP,15014/TCP        61m
service/jaeger-collector       ClusterIP   10.0.216.87    <none>        14268/TCP,14250/TCP,9411/TCP                 7m9s
service/kiali                  NodePort    10.0.160.103   <none>        20001:30590/TCP,9090:30087/TCP               37m
service/tracing                ClusterIP   10.0.193.106   <none>        80/TCP,16685/TCP                             7m9s
service/zipkin                 ClusterIP   10.0.236.39    <none>        9411/TCP                                     7m9s
四、安装 Prometheus 和 Grafana
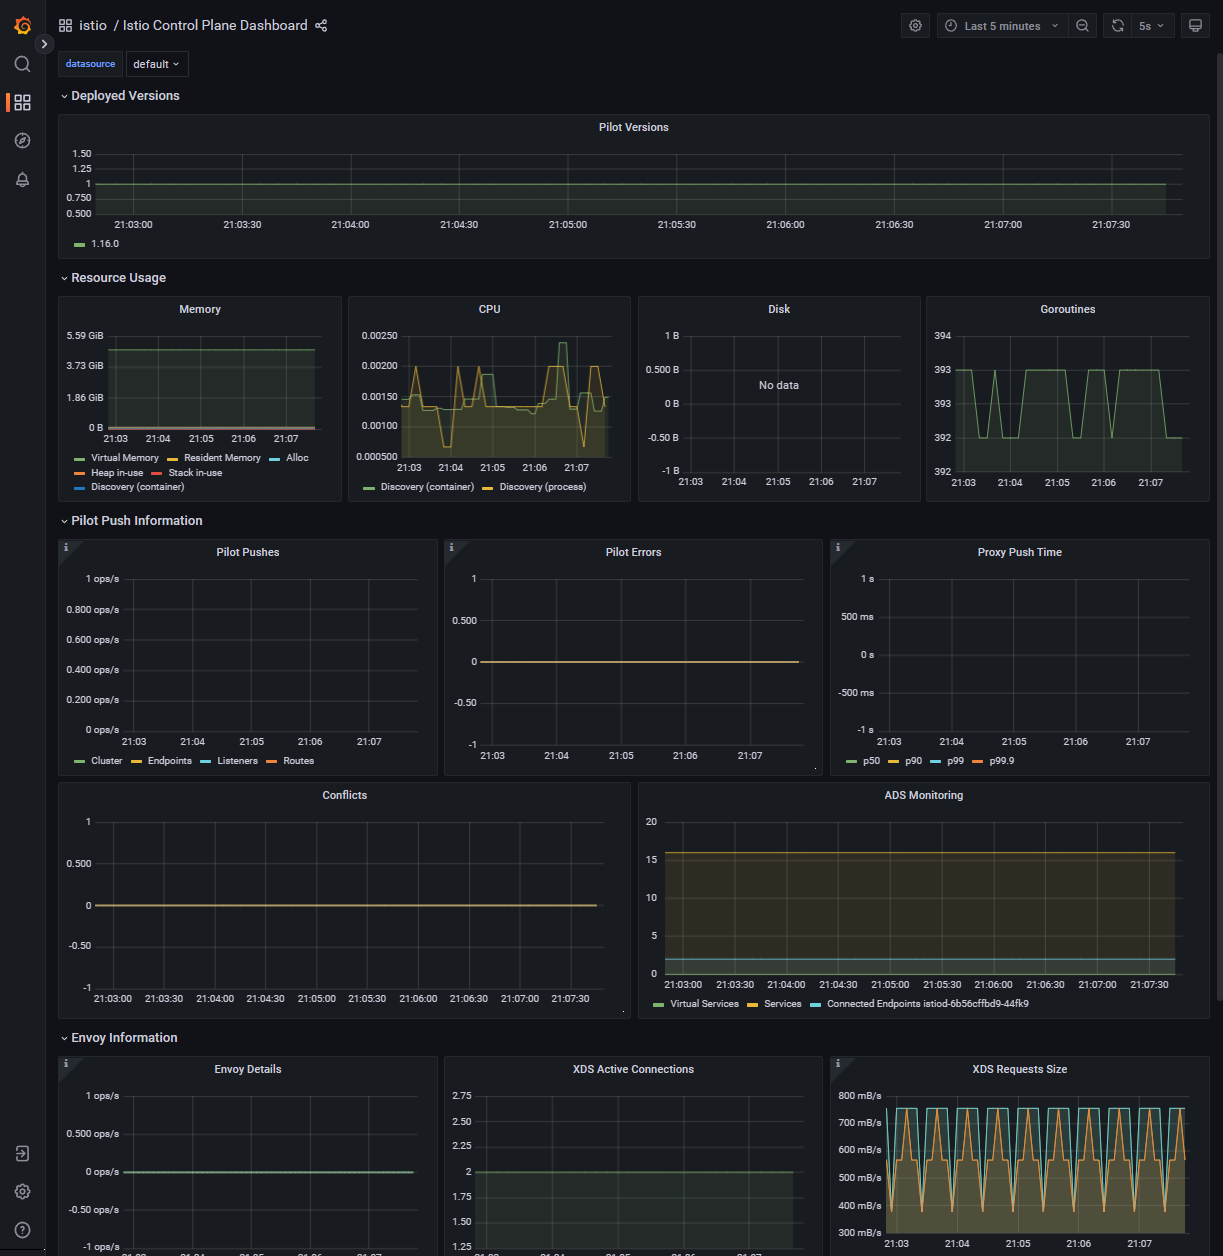
Istio 默认暴露了很多监控指标,比如请求数量统计、请求持续时间以及 Service 和工作 负载的指标,这些指标可以使用 Prometheus 进行收集,Grafana 进行展示。
1.Istio 内置了 Prometheus 和 Grafana 的安装文件,直接安装即可(也可以使用外置的 Prometheus 和 Grafana)
[root@k8s-master01 ~]# cd istio-1.16.0
[root@k8s-master01 istio-1.16.0]# kubectl create -f samples/addons/prometheus.yaml,samples/addons/grafana.yaml
查看创建的 Pod 和 Service
[root@k8s-master01 istio-1.16.0]# kubectl get svc,pod -n istio-system
NAME                           TYPE        CLUSTER-IP     EXTERNAL-IP   PORT(S)                                      AGE
service/grafana                ClusterIP   10.0.117.244   <none>        3000/TCP                                     2m38s
service/istio-ingressgateway   NodePort    10.0.26.1      <none>        15020:30520/TCP,80:30080/TCP,443:30443/TCP   63m
service/istiod                 ClusterIP   10.0.149.172   <none>        15010/TCP,15012/TCP,443/TCP,15014/TCP        66m
service/jaeger-collector       ClusterIP   10.0.216.87    <none>        14268/TCP,14250/TCP,9411/TCP                 12m
service/kiali                  NodePort    10.0.160.103   <none>        20001:30590/TCP,9090:30087/TCP               42m
service/prometheus             ClusterIP   10.0.232.110   <none>        9090/TCP                                     2m38s
service/tracing                ClusterIP   10.0.193.106   <none>        80/TCP,16685/TCP                             12m
service/zipkin                 ClusterIP   10.0.236.39    <none>        9411/TCP                                     12m

NAME                                        READY   STATUS              RESTARTS   AGE
pod/grafana-b854c6c8-mh9jl                  1/1     Running             0          2m38s
pod/istio-ingressgateway-868f5445cf-ztvcv   1/1     Running             0          63m
pod/istiod-6b56cffbd9-44fk9                 1/1     Running             0          66m
pod/jaeger-54b7b57547-vhjhl                 1/1     Running             0          12m
pod/kiali-689fbdb586-vbr8s                  1/1     Running             0          42m
pod/prometheus-7b8b9dd44c-brhkk             2/2     Running             0          2m38s
2.将 Grafana 的 Service 改成 NodePort
[root@k8s-master01 istio-1.16.0]# kubectl edit svc grafana -n istio-system
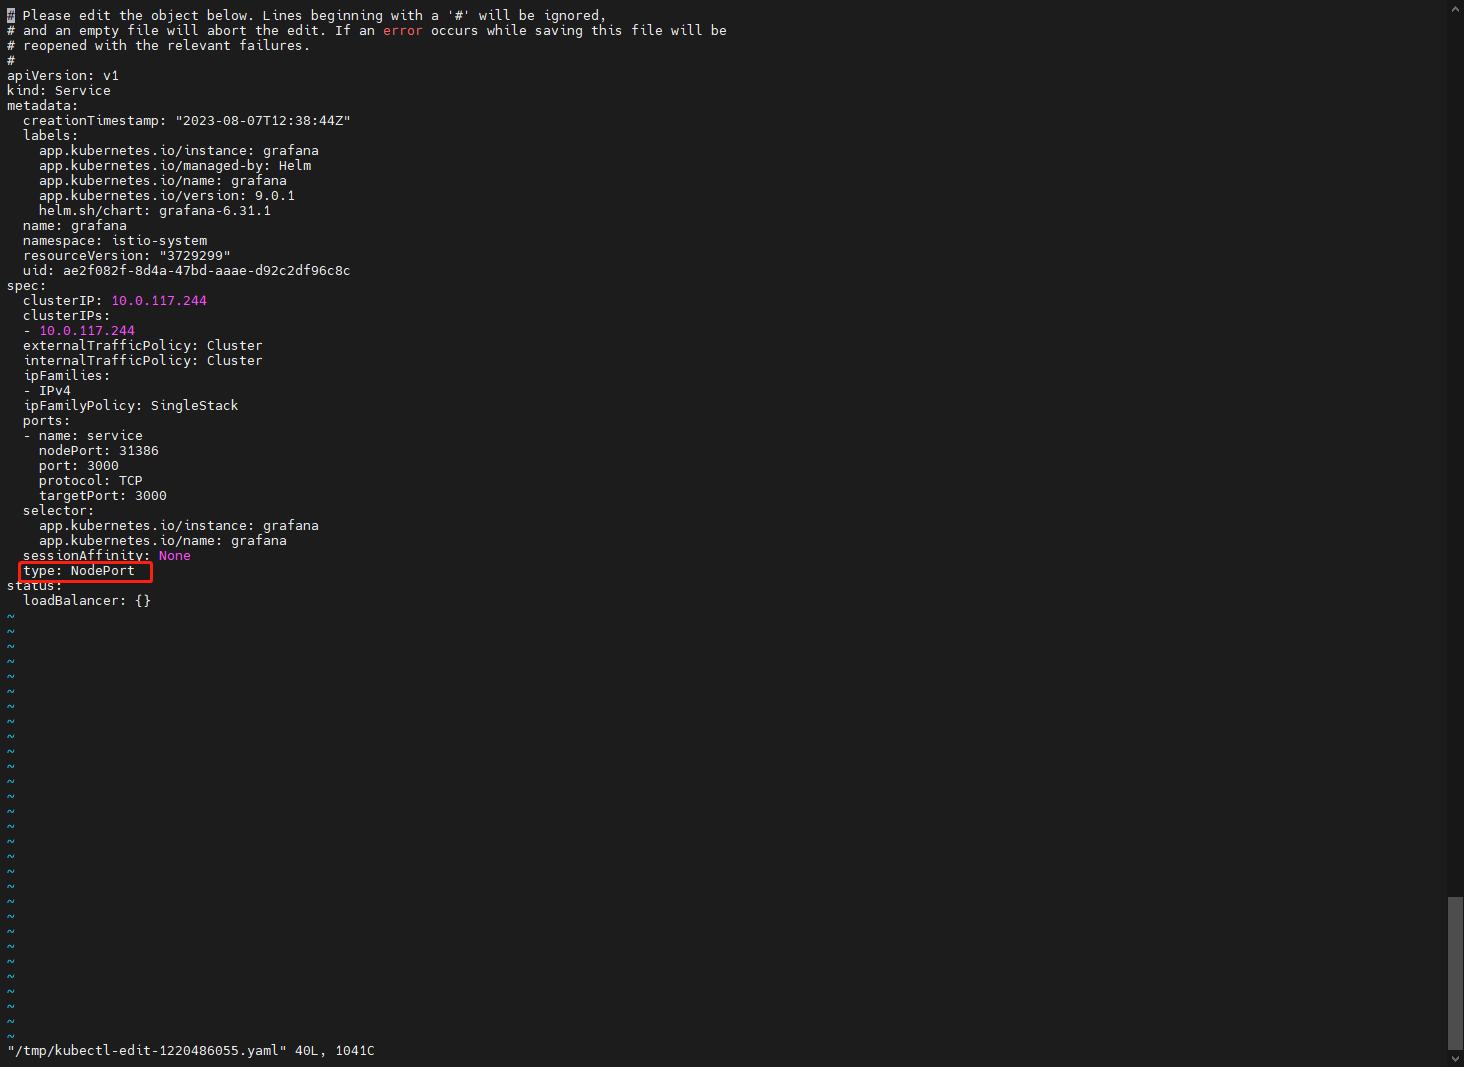
获取grafana对外开放的端口,观察到为31386
[root@k8s-master01 istio-1.16.0]# kubectl get svc -n istio-system
NAME                   TYPE        CLUSTER-IP     EXTERNAL-IP   PORT(S)                                      AGE
grafana                NodePort    10.0.117.244   <none>        3000:31386/TCP                               22m
istio-ingressgateway   NodePort    10.0.26.1      <none>        15020:30520/TCP,80:30080/TCP,443:30443/TCP   83m
istiod                 ClusterIP   10.0.149.172   <none>        15010/TCP,15012/TCP,443/TCP,15014/TCP        86m
jaeger-collector       ClusterIP   10.0.216.87    <none>        14268/TCP,14250/TCP,9411/TCP                 32m
kiali                  NodePort    10.0.160.103   <none>        20001:30590/TCP,9090:30087/TCP               62m
prometheus             ClusterIP   10.0.232.110   <none>        9090/TCP                                     22m
tracing                ClusterIP   10.0.193.106   <none>        80/TCP,16685/TCP                             32m
zipkin                 ClusterIP   10.0.236.39    <none>        9411/TCP                                     32m
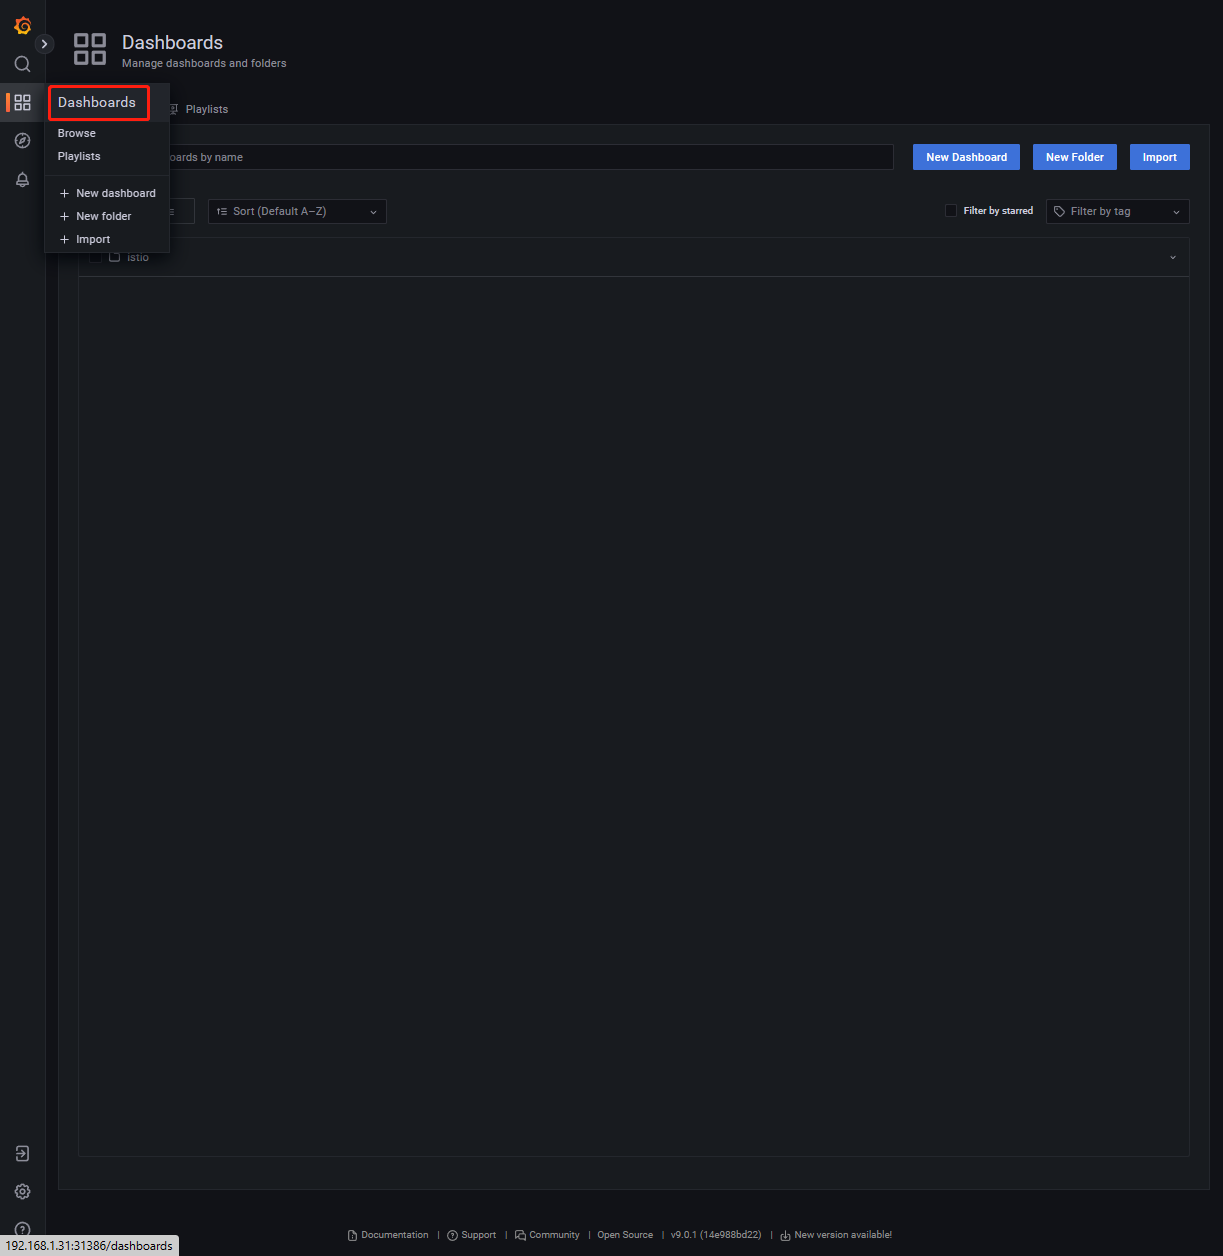
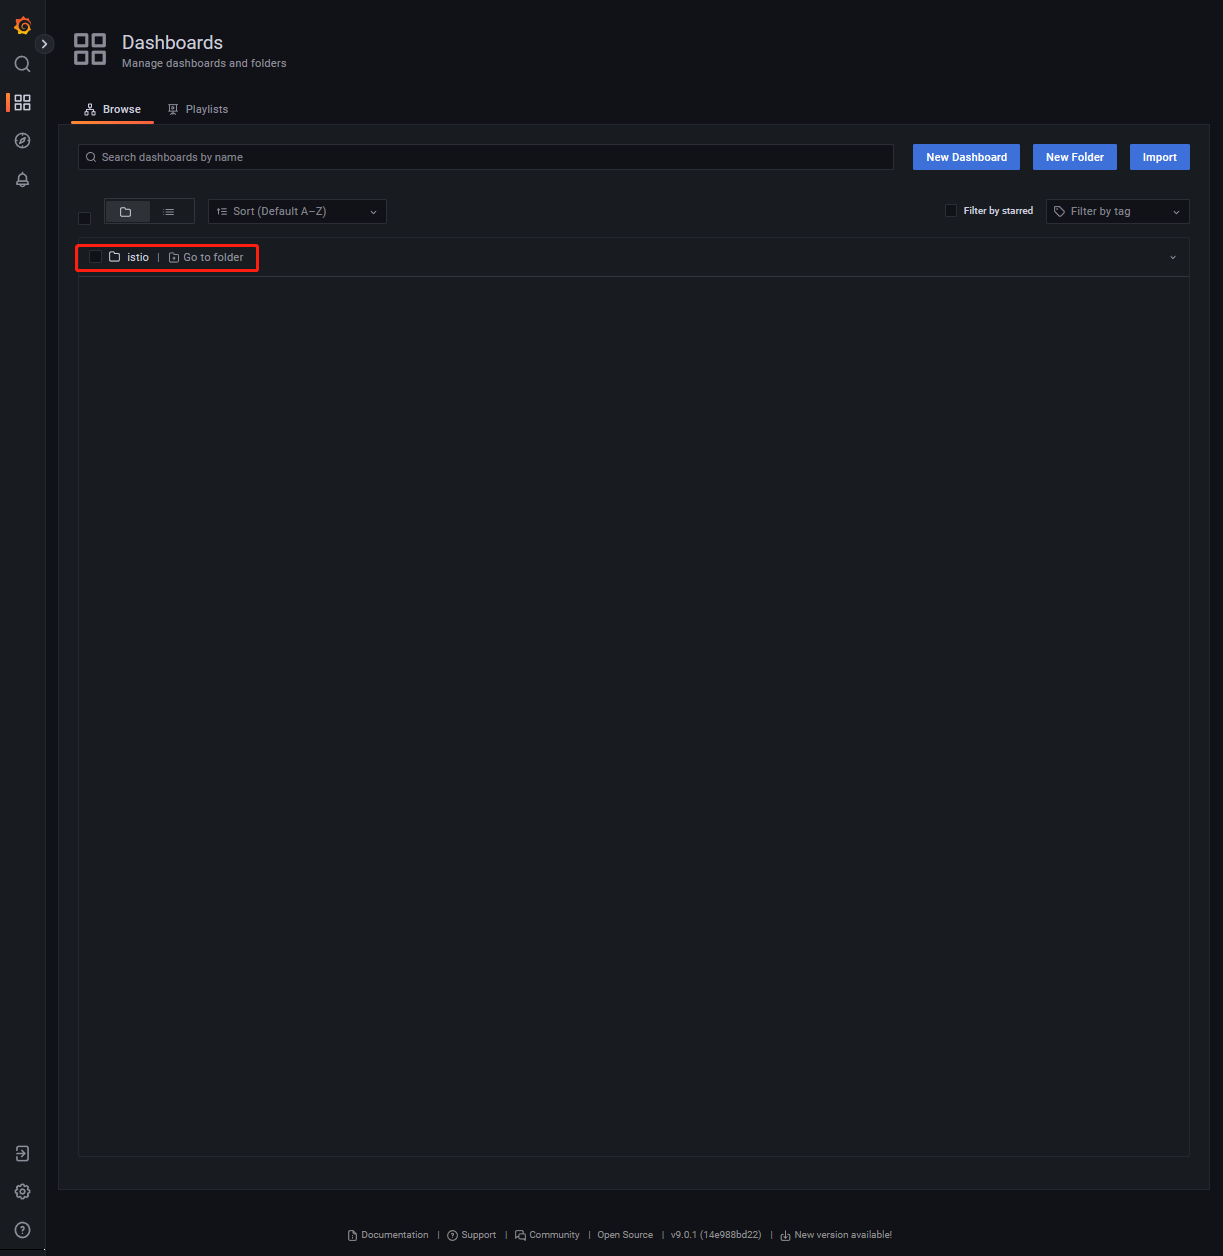
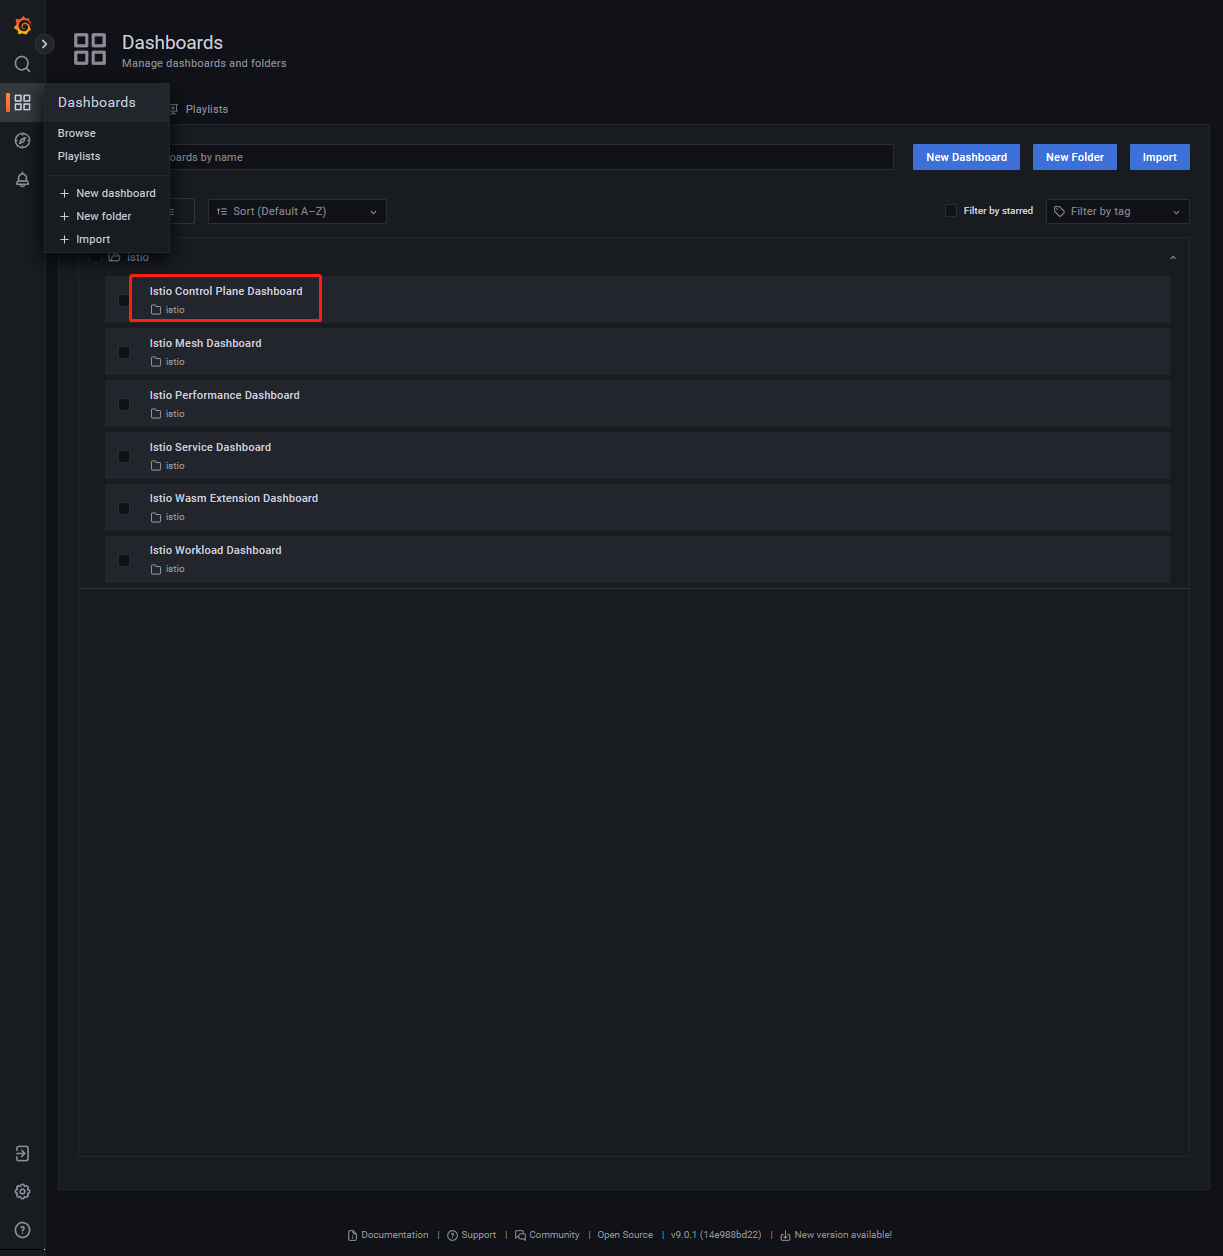
3.打开浏览器输入Node IP +31386进行访问grafana 服务
依次点击【Dashboards】-【istio】-【Istio Control Plane Dashboard】