

一、数据背景
在海量数据场景下,日志管理和分析是一项重要任务。为了解决这个问题,EFK 架构 (Elasticsearch + Fluentd + Kibana)已经成为流行的选择。
然而,随着数据规模的增加,传统的 EFK 架构可能面临性能瓶颈和可用性挑战。为了提 升架构的性能和可伸缩性,我们可以结合 Kafka 和 Logstash 对 EFK 架构进行优化升级。
首先,引入 Kafka 作为高吞吐量的消息队列是关键的一步。Kafka 可以接收和缓冲大量 的日志数据,减轻 Elasticsearch 的压力,并提供更好的可用性和容错性。
然后,我们可以使用 Fluentd 或 Logstash 将日志数据发送到 Kafka 中。将 Kafka 视为 中间件层,用于处理日志数据流。这样可以解耦 Fluentd 或 Logstash 和 Elasticsearch 之间的直接连接,提高整体的可靠性和灵活性。
通过 Logstash 的 Kafka 插件,我们可以将 Kafka 中的数据消费到 Logstash 中进行处理 和转发。这样 Logstash 就负责从 Kafka 中获取数据,然后根据需要进行过滤、解析和转换,最终将数据发送到 Elasticsearch 进行存储和索引。

二、KAFKA部署配置
首先在 Kubernetes 集群中安装 Kafka,同样这里使用 Helm 进行安装:
$ helm repo add bitnami https://charts.bitnami.com/bitnami
$ helm repo update
首先使用 helm pull 拉取 Chart 并解压:
$ helm pull bitnami/kafka --untar --version 17.2.3
$ cd kafka
这里面我们指定使用一个 StorageClass 来提供持久化存储,在 Chart 目录下面创建用于安装的values 文件:
# 修改kafa的values.yaml
[root@master01 kafka]# vim values.yaml
## 修改镜像为国内镜像
...
image:
  registry: registry.cn-hangzhou.aliyuncs.com
  repository: github_images1024/kafka
  tag: 3.2.0-debian-10-r4
...
    image:
      registry: registry.cn-hangzhou.aliyuncs.com
      repository: github_images1024/kubectl
      tag: 1.24.0-debian-10-r5
...
  image:
    registry: registry.cn-hangzhou.aliyuncs.com
    repository: github_images1024/bitnami-shell
    tag: 10-debian-10-r434
...
    image:
      registry: registry.cn-hangzhou.aliyuncs.com
      repository: github_images1024/kafka-exporter
      tag: 1.4.2-debian-10-r243
...
    image:
      registry: registry.cn-hangzhou.aliyuncs.com
      repository: github_images1024/jmx-exporter
      tag: 0.16.1-debian-10-r306

## @section Persistence parameters
persistence:
  enabled: true
  storageClass: "nfs-storage"
  accessModes:
    - ReadWriteOnce
  size: 30Gi

  mountPath: /bitnami/kafka

## 修改镜像为国内镜像
  image:
    registry: registry.cn-hangzhou.aliyuncs.com
    repository: github_images1024/bitnami-shell
    tag: 10-debian-10-r431
    pullPolicy: IfNotPresent
...
image:
  registry: registry.cn-hangzhou.aliyuncs.com
  repository: github_images1024/zookeeper
  tag: 3.8.0-debian-10-r64

# 修改kafa的values.yaml
[root@master01 kafka]# vim values.yaml
##修改第69行和第70行内容
  69   registry: registry.cn-hangzhou.aliyuncs.com
  70   repository: github_images1024/kafka

##修改第751行和第752行内容
 751       registry: registry.cn-hangzhou.aliyuncs.com
 752       repository: github_images1024/kubectl

##修改第978行和第979行内容
 978     registry: registry.cn-hangzhou.aliyuncs.com
 979     repository: github_images1024/bitnami-shell

##修改第1056行和第1057行内容
1056       registry: registry.cn-hangzhou.aliyuncs.com
1057       repository: github_images1024/kafka-exporter

##修改第1290行和第1291行内容
1290       registry: registry.cn-hangzhou.aliyuncs.com
1291       repository: github_images1024/jmx-exporter

##修改第903行内容
 903   storageClass: "nfs-storage"
##修改第910行内容
 910   size: 30Gi
##修改第1670行内容
1670     storageClass: "nfs-storage"
##修改第1673行内容
    size: 30Gi

# kafka完整values.yaml
[root@master01 kafka]# egrep -v "#|^$" values.yaml
global:
  imageRegistry: ""
  imagePullSecrets: []
  storageClass: ""
kubeVersion: ""
nameOverride: ""
fullnameOverride: ""
clusterDomain: cluster.local
commonLabels: {}
commonAnnotations: {}
extraDeploy: []
diagnosticMode:
  enabled: false
  command:
    - sleep
  args:
    - infinity
image:
  registry: registry.cn-hangzhou.aliyuncs.com
  repository: github_images1024/kafka
  tag: 3.2.0-debian-10-r4
  pullPolicy: IfNotPresent
  pullSecrets: []
  debug: false
config: ""
existingConfigmap: ""
log4j: ""
existingLog4jConfigMap: ""
heapOpts: -Xmx1024m -Xms1024m
deleteTopicEnable: false
autoCreateTopicsEnable: true
logFlushIntervalMessages: _10000
logFlushIntervalMs: 1000
logRetentionBytes: _1073741824
logRetentionCheckIntervalMs: 300000
logRetentionHours: 168
logSegmentBytes: _1073741824
logsDirs: /bitnami/kafka/data
maxMessageBytes: _1000012
defaultReplicationFactor: 1
offsetsTopicReplicationFactor: 1
transactionStateLogReplicationFactor: 1
transactionStateLogMinIsr: 1
numIoThreads: 8
numNetworkThreads: 3
numPartitions: 1
numRecoveryThreadsPerDataDir: 1
socketReceiveBufferBytes: 102400
socketRequestMaxBytes: _104857600
socketSendBufferBytes: 102400
zookeeperConnectionTimeoutMs: 6000
zookeeperChrootPath: ""
authorizerClassName: ""
allowEveryoneIfNoAclFound: true
superUsers: User:admin
auth:
  clientProtocol: plaintext
  externalClientProtocol: ""
  interBrokerProtocol: plaintext
  sasl:
    mechanisms: plain,scram-sha-256,scram-sha-512
    interBrokerMechanism: plain
    jaas:
      clientUsers:
        - user
      clientPasswords: []
      interBrokerUser: admin
      interBrokerPassword: ""
      zookeeperUser: ""
      zookeeperPassword: ""
      existingSecret: ""
  tls:
    type: jks
    pemChainIncluded: false
    existingSecrets: []
    autoGenerated: false
    password: ""
    existingSecret: ""
    jksTruststoreSecret: ""
    jksKeystoreSAN: ""
    jksTruststore: ""
    endpointIdentificationAlgorithm: https
  zookeeper:
    tls:
      enabled: false
      type: jks
      verifyHostname: true
      existingSecret: ""
      existingSecretKeystoreKey: zookeeper.keystore.jks
      existingSecretTruststoreKey: zookeeper.truststore.jks
      passwordsSecret: ""
      passwordsSecretKeystoreKey: keystore-password
      passwordsSecretTruststoreKey: truststore-password
listeners: []
advertisedListeners: []
listenerSecurityProtocolMap: ""
allowPlaintextListener: true
interBrokerListenerName: INTERNAL
command:
  - /scripts/setup.sh
args: []
extraEnvVars: []
extraEnvVarsCM: ""
extraEnvVarsSecret: ""
replicaCount: 1
minBrokerId: 0
containerPorts:
  client: 9092
  internal: 9093
  external: 9094
livenessProbe:
  enabled: true
  initialDelaySeconds: 10
  timeoutSeconds: 5
  failureThreshold: 3
  periodSeconds: 10
  successThreshold: 1
readinessProbe:
  enabled: true
  initialDelaySeconds: 5
  failureThreshold: 6
  timeoutSeconds: 5
  periodSeconds: 10
  successThreshold: 1
startupProbe:
  enabled: false
  initialDelaySeconds: 30
  periodSeconds: 10
  timeoutSeconds: 1
  failureThreshold: 15
  successThreshold: 1
customLivenessProbe: {}
customReadinessProbe: {}
customStartupProbe: {}
lifecycleHooks: {}
resources:
  limits: {}
  requests: {}
podSecurityContext:
  enabled: true
  fsGroup: 1001
containerSecurityContext:
  enabled: true
  runAsUser: 1001
  runAsNonRoot: true
hostAliases: []
hostNetwork: false
hostIPC: false
podLabels: {}
podAnnotations: {}
podAffinityPreset: ""
podAntiAffinityPreset: soft
nodeAffinityPreset:
  type: ""
  key: ""
  values: []
affinity: {}
nodeSelector: {}
tolerations: []
topologySpreadConstraints: {}
terminationGracePeriodSeconds: ""
podManagementPolicy: Parallel
priorityClassName: ""
schedulerName: ""
updateStrategy:
  type: RollingUpdate
  rollingUpdate: {}
extraVolumes: []
extraVolumeMounts: []
sidecars: []
initContainers: []
pdb:
  create: false
  minAvailable: ""
  maxUnavailable: 1
service:
  type: ClusterIP
  ports:
    client: 9092
    internal: 9093
    external: 9094
  nodePorts:
    client: ""
    external: ""
  sessionAffinity: None
  sessionAffinityConfig: {}
  clusterIP: ""
  loadBalancerIP: ""
  loadBalancerSourceRanges: []
  externalTrafficPolicy: Cluster
  annotations: {}
  headless:
    annotations: {}
    labels: {}
  extraPorts: []
externalAccess:
  enabled: false
  autoDiscovery:
    enabled: false
    image:
      registry: registry.cn-hangzhou.aliyuncs.com
      repository: github_images1024/kubectl
      tag: 1.24.0-debian-10-r5
      pullPolicy: IfNotPresent
      pullSecrets: []
    resources:
      limits: {}
      requests: {}
  service:
    type: LoadBalancer
    ports:
      external: 9094
    loadBalancerIPs: []
    loadBalancerNames: []
    loadBalancerAnnotations: []
    loadBalancerSourceRanges: []
    nodePorts: []
    useHostIPs: false
    usePodIPs: false
    domain: ""
    annotations: {}
    extraPorts: []
networkPolicy:
  enabled: false
  allowExternal: true
  explicitNamespacesSelector: {}
  externalAccess:
    from: []
  egressRules:
    customRules: []
persistence:
  enabled: true
  existingClaim: ""
  storageClass: "nfs-storage"
  accessModes:
    - ReadWriteOnce
  size: 30Gi
  annotations: {}
  selector: {}
  mountPath: /bitnami/kafka
logPersistence:
  enabled: false
  existingClaim: ""
  storageClass: ""
  accessModes:
    - ReadWriteOnce
  size: 8Gi
  annotations: {}
  selector: {}
  mountPath: /opt/bitnami/kafka/logs
volumePermissions:
  enabled: false
  image:
    registry: registry.cn-hangzhou.aliyuncs.com
    repository: github_images1024/bitnami-shell
    tag: 10-debian-10-r434
    pullPolicy: IfNotPresent
    pullSecrets: []
  resources:
    limits: {}
    requests: {}
  containerSecurityContext:
    runAsUser: 0
serviceAccount:
  create: true
  name: ""
  automountServiceAccountToken: true
  annotations: {}
rbac:
  create: false
metrics:
  kafka:
    enabled: false
    image:
      registry: registry.cn-hangzhou.aliyuncs.com
      repository: github_images1024/kafka-exporter
      tag: 1.4.2-debian-10-r243
      pullPolicy: IfNotPresent
      pullSecrets: []
    certificatesSecret: ""
    tlsCert: cert-file
    tlsKey: key-file
    tlsCaSecret: ""
    tlsCaCert: ca-file
    extraFlags: {}
    command: []
    args: []
    containerPorts:
      metrics: 9308
    resources:
      limits: {}
      requests: {}
    podSecurityContext:
      enabled: true
      fsGroup: 1001
    containerSecurityContext:
      enabled: true
      runAsUser: 1001
      runAsNonRoot: true
    hostAliases: []
    podLabels: {}
    podAnnotations: {}
    podAffinityPreset: ""
    podAntiAffinityPreset: soft
    nodeAffinityPreset:
      type: ""
      key: ""
      values: []
    affinity: {}
    nodeSelector: {}
    tolerations: []
    schedulerName: ""
    priorityClassName: ""
    topologySpreadConstraints: []
    extraVolumes: []
    extraVolumeMounts: []
    sidecars: []
    initContainers: []
    service:
      ports:
        metrics: 9308
      clusterIP: ""
      sessionAffinity: None
      annotations:
        prometheus.io/scrape: "true"
        prometheus.io/port: "{{ .Values.metrics.kafka.service.ports.metrics }}"
        prometheus.io/path: "/metrics"
    serviceAccount:
      create: true
      name: ""
      automountServiceAccountToken: true
  jmx:
    enabled: false
    image:
      registry: registry.cn-hangzhou.aliyuncs.com
      repository: github_images1024/jmx-exporter
      tag: 0.16.1-debian-10-r306
      pullPolicy: IfNotPresent
      pullSecrets: []
    containerSecurityContext:
      enabled: true
      runAsUser: 1001
      runAsNonRoot: true
    containerPorts:
      metrics: 5556
    resources:
      limits: {}
      requests: {}
    service:
      ports:
        metrics: 5556
      clusterIP: ""
      sessionAffinity: None
      annotations:
        prometheus.io/scrape: "true"
        prometheus.io/port: "{{ .Values.metrics.jmx.service.ports.metrics }}"
        prometheus.io/path: "/"
    whitelistObjectNames:
      - kafka.controller:*
      - kafka.server:*
      - java.lang:*
      - kafka.network:*
      - kafka.log:*
    config: |-
      jmxUrl: service:jmx:rmi:///jndi/rmi://127.0.0.1:5555/jmxrmi
      lowercaseOutputName: true
      lowercaseOutputLabelNames: true
      ssl: false
      {{- if .Values.metrics.jmx.whitelistObjectNames }}
      whitelistObjectNames: ["{{ join "\",\"" .Values.metrics.jmx.whitelistObjectNames }}"]
      {{- end }}
    existingConfigmap: ""
  serviceMonitor:
    enabled: false
    namespace: ""
    interval: ""
    scrapeTimeout: ""
    labels: {}
    selector: {}
    relabelings: []
    metricRelabelings: []
    honorLabels: false
    jobLabel: ""
provisioning:
  enabled: false
  numPartitions: 1
  replicationFactor: 1
  topics: []
  tolerations: []
  extraProvisioningCommands: []
  parallel: 1
  preScript: ""
  postScript: ""
  auth:
    tls:
      type: jks
      certificatesSecret: ""
      cert: tls.crt
      key: tls.key
      caCert: ca.crt
      keystore: keystore.jks
      truststore: truststore.jks
      passwordsSecret: ""
      keyPasswordSecretKey: key-password
      keystorePasswordSecretKey: keystore-password
      truststorePasswordSecretKey: truststore-password
      keyPassword: ""
      keystorePassword: ""
      truststorePassword: ""
  command: []
  args: []
  extraEnvVars: []
  extraEnvVarsCM: ""
  extraEnvVarsSecret: ""
  podAnnotations: {}
  podLabels: {}
  resources:
    limits: {}
    requests: {}
  podSecurityContext:
    enabled: true
    fsGroup: 1001
  containerSecurityContext:
    enabled: true
    runAsUser: 1001
    runAsNonRoot: true
  schedulerName: ""
  extraVolumes: []
  extraVolumeMounts: []
  sidecars: []
  initContainers: []
  waitForKafka: true
zookeeper:
  enabled: true
  replicaCount: 1
  auth:
    enabled: false
    clientUser: ""
    clientPassword: ""
    serverUsers: ""
    serverPasswords: ""
  persistence:
    enabled: true
    storageClass: "nfs-storage"
    accessModes:
      - ReadWriteOnce
    size: 30Gi
externalZookeeper:
  servers: []

# 修改zk的values.yaml
[root@master01 kafka]# vim charts/zookeeper/values.yaml
##修改第76行和第77行内容
 76   registry: registry.cn-hangzhou.aliyuncs.com
 77   repository: github_images1024/zookeeper

##修改第622行和第623行内容
622     registry: registry.cn-hangzhou.aliyuncs.com
623     repository: github_images1024/bitnami-shell

# zk的values.yaml完整配置文件
[root@master01 kafka]# egrep -v "#|^$" charts/zookeeper/values.yaml
global:
  imageRegistry: ""
  imagePullSecrets: []
  storageClass: ""
kubeVersion: ""
nameOverride: ""
fullnameOverride: ""
clusterDomain: cluster.local
extraDeploy: []
commonLabels: {}
commonAnnotations: {}
namespaceOverride: ""
diagnosticMode:
  enabled: false
  command:
    - sleep
  args:
    - infinity
image:
  registry: registry.cn-hangzhou.aliyuncs.com
  repository: github_images1024/zookeeper
  tag: 3.8.0-debian-10-r64
  pullPolicy: IfNotPresent
  pullSecrets: []
  debug: false
auth:
  enabled: false
  clientUser: ""
  clientPassword: ""
  serverUsers: ""
  serverPasswords: ""
  existingSecret: ""
tickTime: 2000
initLimit: 10
syncLimit: 5
preAllocSize: 65536
snapCount: 100000
maxClientCnxns: 60
maxSessionTimeout: 40000
heapSize: 1024
fourlwCommandsWhitelist: srvr, mntr, ruok
minServerId: 1
listenOnAllIPs: false
autopurge:
  snapRetainCount: 3
  purgeInterval: 0
logLevel: ERROR
jvmFlags: ""
dataLogDir: ""
configuration: ""
existingConfigmap: ""
extraEnvVars: []
extraEnvVarsCM: ""
extraEnvVarsSecret: ""
command:
  - /scripts/setup.sh
args: []
replicaCount: 1
containerPorts:
  client: 2181
  tls: 3181
  follower: 2888
  election: 3888
livenessProbe:
  enabled: true
  initialDelaySeconds: 30
  periodSeconds: 10
  timeoutSeconds: 5
  failureThreshold: 6
  successThreshold: 1
  probeCommandTimeout: 2
readinessProbe:
  enabled: true
  initialDelaySeconds: 5
  periodSeconds: 10
  timeoutSeconds: 5
  failureThreshold: 6
  successThreshold: 1
  probeCommandTimeout: 2
startupProbe:
  enabled: false
  initialDelaySeconds: 30
  periodSeconds: 10
  timeoutSeconds: 1
  failureThreshold: 15
  successThreshold: 1
customLivenessProbe: {}
customReadinessProbe: {}
customStartupProbe: {}
lifecycleHooks: {}
resources:
  limits: {}
  requests:
    memory: 256Mi
    cpu: 250m
podSecurityContext:
  enabled: true
  fsGroup: 1001
containerSecurityContext:
  enabled: true
  runAsUser: 1001
  runAsNonRoot: true
hostAliases: []
podLabels: {}
podAnnotations: {}
podAffinityPreset: ""
podAntiAffinityPreset: soft
nodeAffinityPreset:
  type: ""
  key: ""
  values: []
affinity: {}
nodeSelector: {}
tolerations: []
topologySpreadConstraints: {}
podManagementPolicy: Parallel
priorityClassName: ""
schedulerName: ""
updateStrategy:
  type: RollingUpdate
  rollingUpdate: {}
extraVolumes: []
extraVolumeMounts: []
sidecars: []
initContainers: []
pdb:
  create: false
  minAvailable: ""
  maxUnavailable: 1
service:
  type: ClusterIP
  ports:
    client: 2181
    tls: 3181
    follower: 2888
    election: 3888
  nodePorts:
    client: ""
    tls: ""
  disableBaseClientPort: false
  sessionAffinity: None
  clusterIP: ""
  loadBalancerIP: ""
  loadBalancerSourceRanges: []
  externalTrafficPolicy: Cluster
  annotations: {}
  extraPorts: []
  headless:
    publishNotReadyAddresses: true
    annotations: {}
networkPolicy:
  enabled: false
  allowExternal: true
serviceAccount:
  create: false
  name: ""
  automountServiceAccountToken: true
  annotations: {}
persistence:
  enabled: true
  existingClaim: ""
  storageClass: ""
  accessModes:
    - ReadWriteOnce
  size: 8Gi
  annotations: {}
  selector: {}
  dataLogDir:
    size: 8Gi
    existingClaim: ""
    selector: {}
volumePermissions:
  enabled: false
  image:
    registry: registry.cn-hangzhou.aliyuncs.com
    repository: github_images1024/bitnami-shell
    tag: 10-debian-10-r431
    pullPolicy: IfNotPresent
    pullSecrets: []
  resources:
    limits: {}
    requests: {}
  containerSecurityContext:
    runAsUser: 0
metrics:
  enabled: false
  containerPort: 9141
  service:
    type: ClusterIP
    port: 9141
    annotations:
      prometheus.io/scrape: "true"
      prometheus.io/port: "{{ .Values.metrics.service.port }}"
      prometheus.io/path: "/metrics"
  serviceMonitor:
    enabled: false
    namespace: ""
    interval: ""
    scrapeTimeout: ""
    additionalLabels: {}
    selector: {}
    relabelings: []
    metricRelabelings: []
    honorLabels: false
    jobLabel: ""
  prometheusRule:
    enabled: false
    namespace: ""
    additionalLabels: {}
    rules: []
tls:
  client:
    enabled: false
    auth: "none"
    autoGenerated: false
    existingSecret: ""
    existingSecretKeystoreKey: ""
    existingSecretTruststoreKey: ""
    keystorePath: /opt/bitnami/zookeeper/config/certs/client/zookeeper.keystore.jks
    truststorePath: /opt/bitnami/zookeeper/config/certs/client/zookeeper.truststore.jks
    passwordsSecretName: ""
    passwordsSecretKeystoreKey: ""
    passwordsSecretTruststoreKey: ""
    keystorePassword: ""
    truststorePassword: ""
  quorum:
    enabled: false
    auth: "none"
    autoGenerated: false
    existingSecret: ""
    existingSecretKeystoreKey: ""
    existingSecretTruststoreKey: ""
    keystorePath: /opt/bitnami/zookeeper/config/certs/quorum/zookeeper.keystore.jks
    truststorePath: /opt/bitnami/zookeeper/config/certs/quorum/zookeeper.truststore.jks
    passwordsSecretName: ""
    passwordsSecretKeystoreKey: ""
    passwordsSecretTruststoreKey: ""
    keystorePassword: ""
    truststorePassword: ""
  resources:
    limits: {}
    requests: {}
直接使用上面的 values 文件安装 kafka:
$ helm upgrade --install kafka -f values.yaml --namespace logging .
Release "kafka" does not exist. Installing it now.
NAME: kafka

LAST DEPLOYED: Fri Jun 30 17:48:51 2023
NAMESPACE: logging
STATUS: deployed
REVISION: 1
TEST SUITE: None
NOTES:
CHART NAME: kafka
CHART VERSION: 17.2.3
APP VERSION: 3.2.0
...
...

# 后期卸载命令
[root@master01 kafka]# helm uninstall kafka  --namespace logging
安装完成后我们可以使用上面的提示来检查 Kafka 是否正常运行:
[root@master01 kafka]# kubectl get pods -n logging -l app.kubernetes.io/instance=kafka
NAME                READY   STATUS    RESTARTS     AGE
kafka-0             1/1     Running   2 (8m ago)   8m14s
kafka-zookeeper-0   1/1     Running   0            8m14s
用下面的命令创建一个 Kafka 的测试客户端 Pod:
# 启动pod
kubectl run kafka-client --restart='Never' --image=registry.cn-hangzhou.aliyuncs.com/github_images1024/kafka:3.2.0-debian-10-r4 --namespace=logging --command -- sleep infinity

# 验证
[root@master01 kafka]# kgp -n logging | grep kafka-client
kafka-client                    1/1     Running   0             35s
然后启动一个终端进入容器内部生产消息:
# 生产者
$ kubectl exec -it kafka-client --namespace logging -- bash
I have no name!@kafka-client:/$ kafka-console-producer.sh --broker-list kafka-0.kafka-headless.logging.svc.cluster.local:9092 --topic test

>hello kafka on k8s
>hello kafka on k9s
启动另外一个终端进入容器内部消费消息:
# 消费者
$ kubectl exec -it kafka-client -n logging -- bash
I have no name!@kafka-client:/$ kafka-console-consumer.sh --bootstrap-server kafka.logging.svc.cluster.local:9092 --topic test --from-beginning

hello kafka on k8s
如果在消费端看到了生产的消息数据证明我们的 Kafka 已经运行成功了。
## 4.3 Fluentd配置Kafka
现在有了 Kafka,我们就可以将 Fluentd 的日志数据输出到 Kafka 了,只需要将 Fluentd 配置中的更改为使用 Kafka 插件即可,但是在 Fluentd 中输出到 Kafka,需要使用到 fluent-plugin-kafka 插件,所以需要我们自定义下 Docker 镜像,最简单的做法就是在上面Fluentd 镜像的基础上新增 Kafka 插件即可,Dockerfile 文件如下所示:
# 下面dockerfile需要在国外服务器上进行构建
[root@master01 kafka]# vim Dockerfile
FROM registry.cn-hangzhou.aliyuncs.com/abroad_images/fluentd:v3.4.0
RUN echo "source 'https://mirrors.tuna.tsinghua.edu.cn/rubygems/'" > Gemfile && gem install bundler -v 2.4.22
RUN gem install fluent-plugin-kafka -v 0.17.5 --no-document
编译:
$ docker build -t registry.cn-hangzhou.aliyuncs.com/abroad_images/fluentd-kafka:v0.17.5 .

$ docker push registry.cn-hangzhou.aliyuncs.com/abroad_images/fluentd-kafka:v0.17.5
接下来替换 Fluentd 的 Configmap 对象中的 \<match> 部分,如下所示:
[root@master01 9]# vim fluentd-configmap.yaml
kind: ConfigMap
apiVersion: v1
metadata:
  name: fluentd-conf
  namespace: logging
data:
  ......
  output.conf: |-
    <match **>
      @id kafka
      @type kafka2
      @log_level info

      # list of seed brokers
      brokers kafka-0.kafka-headless.logging.svc.cluster.local:9092
      use_event_time true

      # topic settings
      topic_key k8slog
      default_topic messages  # 注意,kafka中消费使用的是这个topic
      # buffer settings
      <buffer k8slog>
        @type file
        path /var/log/td-agent/buffer/td
        flush_interval 3s
      </buffer>

      # data type settings
      <format>
        @type json
      </format>

      # producer settings
      required_acks -1
      compression_codec gzip

    </match>

# 完整配置文件
[root@master01 9]# vim fluentd-configmap.yaml
kind: ConfigMap
apiVersion: v1
metadata:
  name: fluentd-conf
  namespace: logging
data:
  system.conf: |-
    <system>
      root_dir /tmp/fluentd-buffers/
    </system>
  fluent.conf: |-
    <source>
      @id fluentd-containers.log
      @type tail
      path /var/log/containers/*.log
      pos_file /var/log/es-containers.log.pos
      tag raw.kubernetes.*
      read_from_head true
      <parse>
        @type multi_format
        <pattern>
          format json
          time_key time
          time_format %Y-%m-%dT%H:%M:%S.%NZ
        </pattern>
        <pattern>
          format /^(?<time>.+) (?<stream>stdout|stderr) [^ ]* (?<log>.*)$/
          time_format %Y-%m-%dT%H:%M:%S.%N%:z
        </pattern>
      </parse>
    </source>

    <match raw.kubernetes.**>
      @id kubernetes
      @type detect_exceptions
      remove_tag_prefix raw
      message log
      stream stream
      multiline_flush_interval 5
      max_bytes 500000
      max_lines 1000
    </match>

    <filter **>
      @id filter_concat
      @type concat
      key message
      multiline_end_regexp /\n$/
      separator ""
    </filter>

    <filter kubernetes.**>
      @id filter_kubernetes_metadata
      @type kubernetes_metadata
    </filter>

    <filter kubernetes.**>
      @id filter_parser
      @type parser
      key_name log
      reserve_data true
      remove_key_name_field true
      <parse>
        @type multi_format
        <pattern>
          format json
        </pattern>
        <pattern>
          format none
        </pattern>
      </parse>
    </filter>

    <filter kubernetes.**>
      @type record_transformer
      remove_keys $.kubernetes.namespace_labels.project,$.kubernetes.pod_ip,$.kubernetes.labels.app,$.docker.container_id,$.kubernetes.container_image_id,$.kubernetes.pod_id,$.kubernetes.namespace_id,$.kubernetes.master_url,$.kubernetes.labels.pod-template-hash
    </filter>

    <filter kubernetes.**>
      @id filter_log
      @type grep
      <regexp>
        key $.kubernetes.labels.logging
        pattern ^true$
      </regexp>
    </filter>

    # ============== 关键修改部分:替换 Elasticsearch 输出为 Kafka ==============
    <match **>
      @id kafka_output
      @type kafka2
      @log_level info

      # Kafka 集群配置
      brokers kafka-0.kafka-headless.logging.svc.cluster.local:9092
      use_event_time true

      # Topic 配置
      topic_key k8slog
      default_topic messages  # 实际使用的 Topic 名称

      # 缓冲区配置(与原有配置统一路径)
      <buffer>
        @type file
        path /var/log/fluentd-buffers/kafka.buffer  # 修改为统一缓冲区路径
        flush_interval 3s
        chunk_limit_size 2M        # 保持与原有配置一致
        queue_limit_length 8       # 保持与原有配置一致
        retry_forever true         # 保持重试策略
        overflow_action block      # 防止数据丢失
      </buffer>

      # 数据格式
      <format>
        @type json
      </format>

      # 生产者高级配置
      required_acks -1             # 所有 ISR 副本确认
      compression_codec gzip       # 压缩算法
      max_send_retries 3           # 增加发送重试次数
    </match>
然后替换运行的 Fluentd 镜像:
[root@master01 9]# vim fluentd-daemonset.yaml
image: registry.cn-hangzhou.aliyuncs.com/abroad_images/fluentd-kafka:v0.17.5

# 完整配置文件
[root@master01 9]# vim fluentd-daemonset.yaml
apiVersion: v1
kind: ServiceAccount
metadata:
  name: fluentd-es
  namespace: logging
  labels:
    k8s-app: fluentd-es
    kubernetes.io/cluster-service: "true"
    addonmanager.kubernetes.io/mode: Reconcile
---
kind: ClusterRole
apiVersion: rbac.authorization.k8s.io/v1
metadata:
  name: fluentd-es
  labels:
    k8s-app: fluentd-es
    kubernetes.io/cluster-service: "true"
    addonmanager.kubernetes.io/mode: Reconcile
rules:
  - apiGroups:
      - ""
    resources:
      - "namespaces"
      - "pods"
    verbs:
      - "get"
      - "watch"
      - "list"
---
kind: ClusterRoleBinding
apiVersion: rbac.authorization.k8s.io/v1
metadata:
  name: fluentd-es
  labels:
    k8s-app: fluentd-es
    kubernetes.io/cluster-service: "true"
    addonmanager.kubernetes.io/mode: Reconcile
subjects:
  - kind: ServiceAccount
    name: fluentd-es
    namespace: logging
    apiGroup: ""
roleRef:
  kind: ClusterRole
  name: fluentd-es
  apiGroup: ""
---
apiVersion: apps/v1
kind: DaemonSet
metadata:
  name: fluentd
  namespace: logging
  labels:
    app: fluentd
    kubernetes.io/cluster-service: "true"
spec:
  selector:
    matchLabels:
      app: fluentd
  template:
    metadata:
      labels:
        app: fluentd
        kubernetes.io/cluster-service: "true"
    spec:
      tolerations:
        - key: node-role.kubernetes.io/master
          effect: NoSchedule
      serviceAccountName: fluentd-es
      containers:
      - name: fluentd
        image: registry.cn-hangzhou.aliyuncs.com/abroad_images/fluentd-kafka:v0.17.5
        volumeMounts:
        - name: fluentconfig
          mountPath: /etc/fluent/config.d
        - name: varlog
          mountPath: /var/log
        - name: varlogpods
          mountPath: /var/log/pods
      volumes:
      - name: fluentconfig
        configMap:
          name: fluentd-conf
      - name: varlog
        hostPath:
          path: /var/log
      - name: varlogpods
        hostPath:
          path: /var/log/pods
直接更新 Fluentd 的 Configmap 与 DaemonSet 资源对象即可:
[root@master01 9]# kubectl apply -f fluentd-configmap.yaml
[root@master01 9]# kubectl apply -f fluentd-daemonset.yaml
更新成功后我们可以使用上面的测试 Kafka 客户端来验证是否有日志数据:
# 模拟日志输出
[root@master01 9]# vim counterlog.yaml
apiVersion: v1
kind: Pod
metadata:
  name: counterlog
  labels:
    logging: "true" # 一定要具有该标签才会被采集
spec:
  containers:
    - name: count
      image: registry.cn-hangzhou.aliyuncs.com/abroad_images/busybox:1.30
      args:
        [
          /bin/sh,
          -c,
          'i=0; while true; do echo "$i: $(date)"; i=$((i+1)); sleep 1; done',
        ]

# 模拟日志输出
[root@master01 9]# kaf counterlog.yaml

$ kubectl exec -it kafka-client -n logging -- bash
I have no name!@kafka-client:/$ kafka-console-consumer.sh --bootstrap-server kafka.logging.svc.cluster.local:9092 --topic messages --from-beginning
{"stream":"stdout","docker":{},"kubernetes":{"container_name":"count","namespace_name":"default","pod_name":"counterlog","container_image":"registry.cn-hangzhou.aliyuncs.com/abroad_images/busybox:1.30","host":"master02","labels":{"logging":"true"},"namespace_labels":{"kubernetes_io/metadata_name":"default"}},"message":"644: Tue Apr 15 06:19:25 UTC 2025"}
...
...
三、安装Logstash
虽然数据从 Kafka 到 Elasticsearch 的方式多种多样,比如可以使用Kafka Connect Elasticsearch Connector来实现,我们这里还是采用更加流行的 Logstash 方案,上 面我们已经将日志从 Fluentd 采集输出到 Kafka 中去了,接下来我们使用 Logstash 来连接 Kafka 与 Elasticsearch 间的日志数据。
首先使用 helm pull 拉取 Chart 并解压:
$ helm pull elastic/logstash --untar --version 7.17.3
$ cd logstash
同样在 Chart 根目录下面创建用于安装的 Values 文件,如下所示:
# 需要修改的几点内容
[root@master01 logstash]# vim values.yaml
fullnameOverride: logstash

persistence:
  enabled: true

logstashConfig:
  logstash.yml: |
    http.host: 0.0.0.0

## 要注意下格式
logstashPipeline:
  logstash.conf: |
    input { kafka { bootstrap_servers => "kafka-0.kafka-headless.logging.svc.cluster.local:9092" codec => json consumer_threads => 3 topics => ["messages"] } }
    filter {}  # 过滤配置(比如可以删除key、添加geoip等等)
    output { elasticsearch { hosts => [ "elasticsearch-master:9200" ] index => "logstash-k8s-%{+YYYY.MM.dd}" } stdout { codec => rubydebug } }

volumeClaimTemplate:
  accessModes: ["ReadWriteOnce"]
  storageClassName: nfs-storage
  resources:
    requests:
      storage: 30Gi

# 具体修改
[root@master01 logstash]# vim values.yaml
##修改第9行内容,并在后面新增两行内容
  9 logstashConfig:
 10   logstash.yml: |
 11     http.host: 0.0.0.0
##修改第20行内容,并在后面新增三行内容
 20 logstashPipeline:
 21   logstash.conf: |
 22     input { kafka { bootstrap_servers => "kafka-0.kafka-headless.logging.svc.cluster.local:    9092" codec => json consumer_threads => 3 topics => ["messages"] } }
 23     filter {}  # 过滤配置(比如可以删除key、添加geoip等等)
 24     output { elasticsearch { hosts => [ "elasticsearch-master:9200" ] index => "logstash-k8s-%{+YYYY.MM.dd}" } stdout { codec => rubydebug } }

##修改第79行内容,替换为国内镜像
 79 image: "registry.cn-hangzhou.aliyuncs.com/github_images1024/logstash"
##在第99行后面新增内容
100   storageClassName: nfs-storage
##修改第104行内容
104       storage: 30Gi
##修改第135行内容
135   enabled: true
##修改第259行内容
259 fullnameOverride: "logstash"

# 完整配置文件
[root@master01 logstash]# egrep -v "#|^$" values.yaml
---
replicas: 1
logstashConfig:
  logstash.yml: |
    http.host: 0.0.0.0
logstashPipeline:
  logstash.conf: |
    input { kafka { bootstrap_servers => "kafka-0.kafka-headless.logging.svc.cluster.local:9092" codec => json consumer_threads => 3 topics => ["messages"] } }
    output { elasticsearch { hosts => [ "elasticsearch-master:9200" ] index => "logstash-k8s-%{+YYYY.MM.dd}" } stdout { codec => rubydebug } }
logstashPatternDir: "/usr/share/logstash/patterns/"
logstashPattern: {}
extraEnvs: []
envFrom: []
secrets: []
secretMounts: []
hostAliases: []
image: "registry.cn-hangzhou.aliyuncs.com/github_images1024/logstash"
imageTag: "7.17.3"
imagePullPolicy: "IfNotPresent"
imagePullSecrets: []
podAnnotations: {}
labels: {}
logstashJavaOpts: "-Xmx1g -Xms1g"
resources:
  requests:
    cpu: "100m"
    memory: "1536Mi"
  limits:
    cpu: "1000m"
    memory: "1536Mi"
volumeClaimTemplate:
  accessModes: ["ReadWriteOnce"]
  storageClassName: nfs-storage
  resources:
    requests:
      storage: 30Gi
rbac:
  create: false
  serviceAccountAnnotations: {}
  serviceAccountName: ""
  annotations:
    {}
podSecurityPolicy:
  create: false
  name: ""
  spec:
    privileged: false
    fsGroup:
      rule: RunAsAny
    runAsUser:
      rule: RunAsAny
    seLinux:
      rule: RunAsAny
    supplementalGroups:
      rule: RunAsAny
    volumes:
      - secret
      - configMap
      - persistentVolumeClaim
persistence:
  enabled: true
  annotations: {}
extraVolumes:
  []
extraVolumeMounts:
  []
extraContainers:
  []
extraInitContainers:
  []
priorityClassName: ""
antiAffinityTopologyKey: "kubernetes.io/hostname"
antiAffinity: "hard"
nodeAffinity: {}
podAffinity: {}
podManagementPolicy: "Parallel"
httpPort: 9600
extraPorts:
  []
updateStrategy: RollingUpdate
maxUnavailable: 1
podSecurityContext:
  fsGroup: 1000
  runAsUser: 1000
securityContext:
  capabilities:
    drop:
      - ALL
  runAsNonRoot: true
  runAsUser: 1000
terminationGracePeriod: 120
livenessProbe:
  httpGet:
    path: /
    port: http
  initialDelaySeconds: 300
  periodSeconds: 10
  timeoutSeconds: 5
  failureThreshold: 3
  successThreshold: 1
readinessProbe:
  httpGet:
    path: /
    port: http
  initialDelaySeconds: 60
  periodSeconds: 10
  timeoutSeconds: 5
  failureThreshold: 3
  successThreshold: 3
schedulerName: ""
nodeSelector: {}
tolerations: []
nameOverride: ""
fullnameOverride: "logstash"
lifecycle:
  {}
service:
  {}
ingress:
  enabled: false
  annotations:
    {}
  className: "nginx"
  pathtype: ImplementationSpecific
  hosts:
    - host: logstash-example.local
      paths:
        - path: /beats
          servicePort: 5044
        - path: /http
          servicePort: 8080
  tls: []
其中最重要的就是通过 logstashPipeline 配置 logstash 数据流的处理配置,通过input 指定日志源 kafka 的配置,通过 output 输出到 Elasticsearch,同样直接使用上面的Values 文件安装 logstash 即可:
# 安装
[root@master01 logstash]# helm upgrade --install logstash -f values.yaml --namespace logging .

Release "logstash" does not exist. Installing it now.
NAME: logstash
LAST DEPLOYED: Fri Jun 30 19:48:51 2023
NAMESPACE: logging
STATUS: deployed
REVISION: 1
TEST SUITE: None
NOTES:
1. Watch all cluster members come up.

# 验证
[root@master01 logstash]# kubectl get pods --namespace=logging -l app=logstash -w
安装启动完成后可以查看 logstash 的日志:
[root@master01 logstash]# kubectl get pods --namespace=logging -l app=logstash
NAME         READY   STATUS    RESTARTS   AGE
logstash-0   1/1     Running   0          2m51s

[root@master01 logstash]# kubectl logs -f logstash-0 -n logging
...
{
    "@timestamp" => 2025-04-15T06:49:35.038Z,
        "stream" => "stdout",
       "message" => "2450: Tue Apr 15 06:49:33 UTC 2025",
    "kubernetes" => {
                    "host" => "master02",
                "pod_name" => "counterlog",
         "container_image" => "registry.cn-hangzhou.aliyuncs.com/abroad_images/busybox:1.30",
                  "labels" => {
            "logging" => "true"
        },
          "namespace_name" => "default",
        "namespace_labels" => {
            "kubernetes_io/metadata_name" => "default"
        },
          "container_name" => "count"
    },
        "docker" => {},
      "@version" => "1"
}
...
由于我们启用了 debug 日志调试,所以我们可以在 logstash 的日志中看到我们采集的日志消息,到这里证明我们的日志数据就获取成功了。
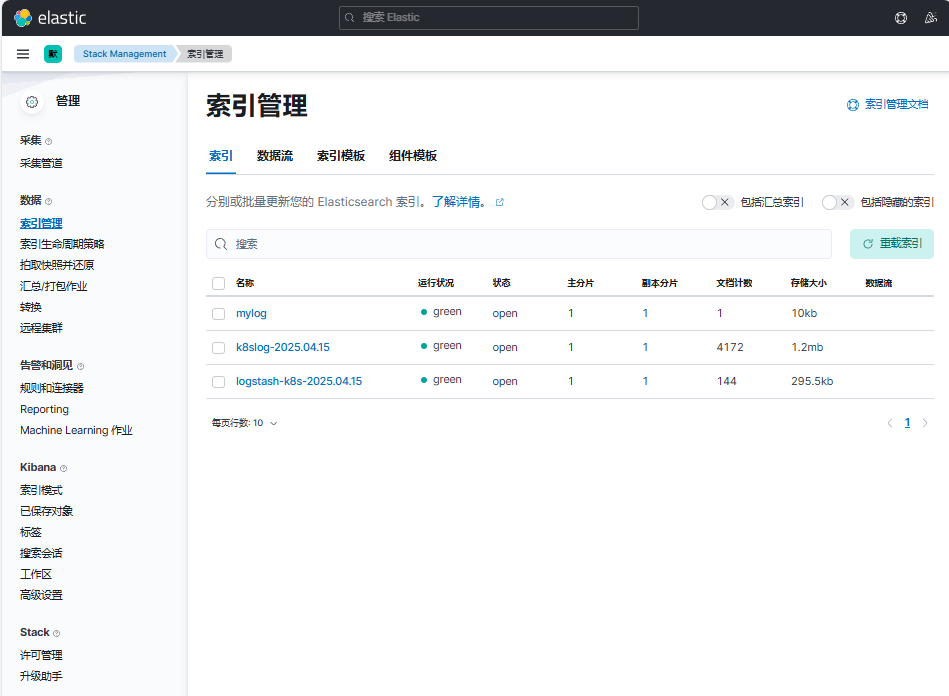
现在我们可以登录到 Kibana 可以看到有如下所示的索引数据了:
依次点击"Management"-"Stack Management"后,点击"索引管理"
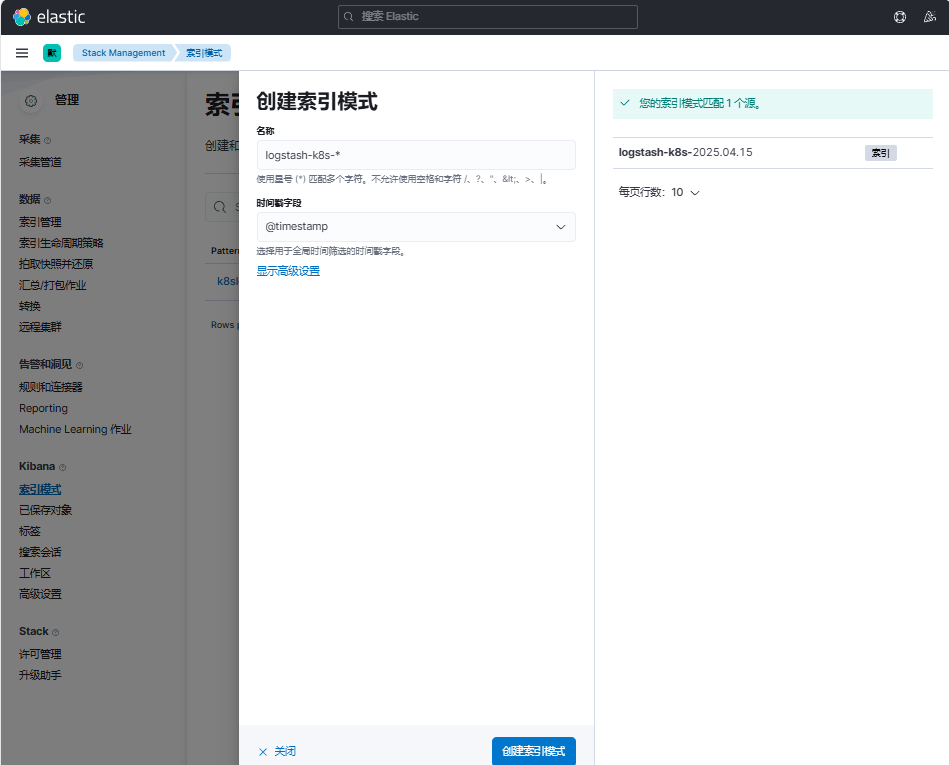
然后同样创建索引模式logstash-k8s-*,匹配上面的索引即可:
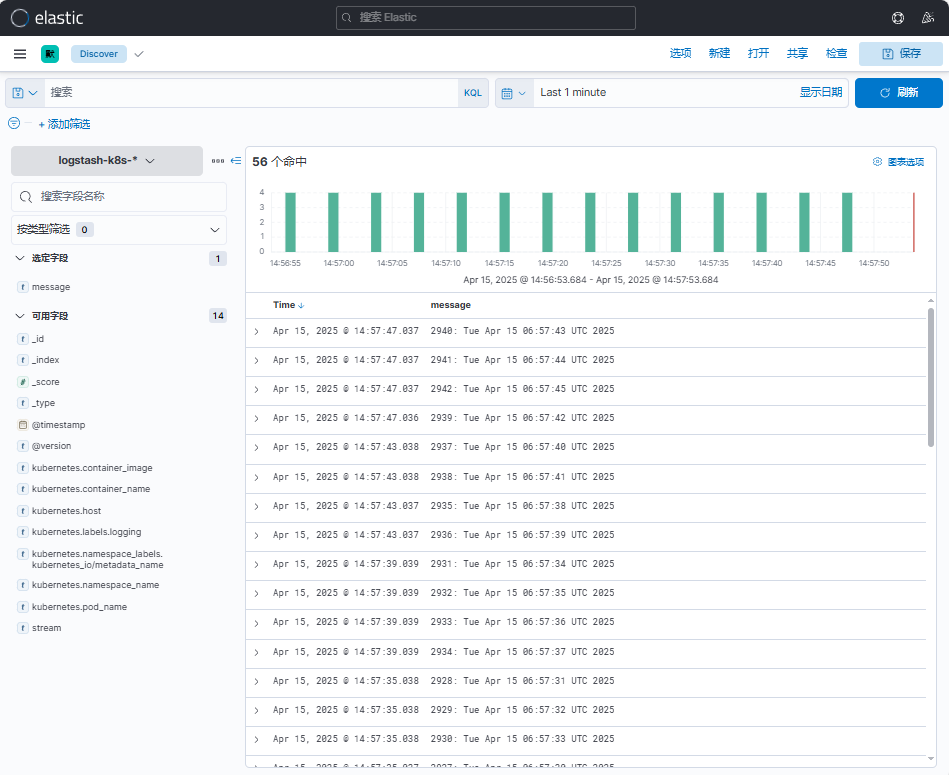
创建完成后就可以前往发现页面过滤日志数据了:
点击"Discover",选择创建的索引模式logstash-k8s-*
到这里我们就实现了一个使用Fluentd+Kafka+Logstash+Elasticsearch+Kibana 的Kubernetes 日志收集工具栈,这里我们完整的 Pod 信息如下所示:
[root@master01 logstash]# kubectl get pods -n logging
NAME                            READY   STATUS    RESTARTS        AGE
elasticsearch-master-0          1/1     Running   0               6h17m
elasticsearch-master-1          1/1     Running   0               6h17m
elasticsearch-master-2          1/1     Running   0               6h17m
fluentd-984c7                   1/1     Running   0               38m
fluentd-9jdgj                   1/1     Running   0               38m
fluentd-ks26d                   1/1     Running   0               38m
fluentd-r8bll                   1/1     Running   0               38m
fluentd-w2pgj                   1/1     Running   0               37m
kafka-0                         1/1     Running   2 (3h36m ago)   3h37m
kafka-client                    1/1     Running   0               3h7m
kafka-zookeeper-0               1/1     Running   0               3h37m
kibana-kibana-55d5cb7b4-p9d55   1/1     Running   0               5h44m
logstash-0                      1/1     Running   0               11m
当然在实际的工作项目中还需要我们根据实际的业务场景来进行参数性能调优以及高可用等设置,以达到系统的最优性能。
上面我们在配置 logstash 的时候是将日志输出到 "logstash-k8s-%{+YYYY.MM.dd}"
这个索引模式的,可能有的场景下只通过日期去区分索引不是很合理;
那么我们可以根据自己的需求去修改索引名称,比如可以根据我们的服务名称来进行区分,那么这个服务名称可以怎么来定义呢?
可以是 Pod 的名称或者通过 label 标签去指定,比如我们这里去做一个规范,要求需要收集日志的 Pod 除了需要添加 logging: true 这个标签之外,还需要添加一个logIndex: <索引名> 的标签。
比如重新更新我们测试的 counter 应用:
[root@master01 9]# cat podlogstash.yaml
apiVersion: v1
kind: Pod
metadata:
  name: counter
  labels:
    logging: "true" # 一定要具有该标签才会被采集
    logIndex: "zhdya"  # 指定索引名称
spec:
  containers:
    - name: count
      image: registry.cn-hangzhou.aliyuncs.com/abroad_images/busybox:1.30
      args:
        [
          /bin/sh,
          -c,
          'i=0; while true; do echo "$i: $(date)"; i=$((i+1)); sleep 1; done',
        ]

# 应用
[root@master01 9]# kaf podlogstash.yaml

# 验证
[root@master01 9]# kgp | grep counter
counter                                    1/1     Running   0               74s
然后重新更新 Logstash 的配置,修改 values 配置
# 修改的内容
[root@master01 logstash]# vim values.yaml
...
...
logstashPipeline:
  logstash.conf: |
    input {
      kafka {
        bootstrap_servers => "kafka-0.kafka-headless.logging.svc.cluster.local:9092"
        codec => json
        consumer_threads => 3
        topics => ["messages"]
      }
    }

    filter {
      # 过滤配置示例(可根据需要取消注释)
      # mutate {
      #   remove_field => ["@version", "host"]
      # }
      # geoip {
      #   source => "client_ip"
      #   target => "geoip"
      # }
    }

    output {
      elasticsearch {
        hosts => [
          "elasticsearch-master:9200"
        ]
        index => "k8s-%{[kubernetes][labels][logIndex]}-%{+YYYY.MM.dd}"
        # 建议添加的生产级配置(可选)
        # user => "elastic"
        # password => "changeme"
        # ssl => true
        # ca_file => "/etc/elasticsearch/ca.crt"
      }
      stdout {
        codec => rubydebug
        # 生产环境建议关闭
        # disabled => true
      }
    }
...
...

# 完整配置文件
[root@master01 logstash]# egrep -v "#|^$" values.yaml
---
replicas: 1
logstashConfig:
  logstash.yml: |
    http.host: 0.0.0.0
logstashPipeline:
  logstash.conf: |
    input {
      kafka {
        bootstrap_servers => "kafka-0.kafka-headless.logging.svc.cluster.local:9092"
        codec => json
        consumer_threads => 3
        topics => ["messages"]
      }
    }
    filter {
    }
    output {
      elasticsearch {
        hosts => [
          "elasticsearch-master:9200"
        ]
        index => "k8s-%{[kubernetes][labels][logIndex]}-%{+YYYY.MM.dd}"
      }
      stdout {
        codec => rubydebug
      }
    }
logstashPatternDir: "/usr/share/logstash/patterns/"
logstashPattern: {}
extraEnvs: []
envFrom: []
secrets: []
secretMounts: []
hostAliases: []
image: "registry.cn-hangzhou.aliyuncs.com/github_images1024/logstash"
imageTag: "7.17.3"
imagePullPolicy: "IfNotPresent"
imagePullSecrets: []
podAnnotations: {}
labels: {}
logstashJavaOpts: "-Xmx1g -Xms1g"
resources:
  requests:
    cpu: "100m"
    memory: "1536Mi"
  limits:
    cpu: "1000m"
    memory: "1536Mi"
volumeClaimTemplate:
  accessModes: ["ReadWriteOnce"]
  storageClassName: nfs-storage
  resources:
    requests:
      storage: 30Gi
rbac:
  create: false
  serviceAccountAnnotations: {}
  serviceAccountName: ""
  annotations:
    {}
podSecurityPolicy:
  create: false
  name: ""
  spec:
    privileged: false
    fsGroup:
      rule: RunAsAny
    runAsUser:
      rule: RunAsAny
    seLinux:
      rule: RunAsAny
    supplementalGroups:
      rule: RunAsAny
    volumes:
      - secret
      - configMap
      - persistentVolumeClaim
persistence:
  enabled: true
  annotations: {}
extraVolumes:
  []
extraVolumeMounts:
  []
extraContainers:
  []
extraInitContainers:
  []
priorityClassName: ""
antiAffinityTopologyKey: "kubernetes.io/hostname"
antiAffinity: "hard"
nodeAffinity: {}
podAffinity: {}
podManagementPolicy: "Parallel"
httpPort: 9600
extraPorts:
  []
updateStrategy: RollingUpdate
maxUnavailable: 1
podSecurityContext:
  fsGroup: 1000
  runAsUser: 1000
securityContext:
  capabilities:
    drop:
      - ALL
  runAsNonRoot: true
  runAsUser: 1000
terminationGracePeriod: 120
livenessProbe:
  httpGet:
    path: /
    port: http
  initialDelaySeconds: 300
  periodSeconds: 10
  timeoutSeconds: 5
  failureThreshold: 3
  successThreshold: 1
readinessProbe:
  httpGet:
    path: /
    port: http
  initialDelaySeconds: 60
  periodSeconds: 10
  timeoutSeconds: 5
  failureThreshold: 3
  successThreshold: 3
schedulerName: ""
nodeSelector: {}
tolerations: []
nameOverride: ""
fullnameOverride: "logstash"
lifecycle:
  {}
service:
  {}
ingress:
  enabled: false
  annotations:
    {}
  className: "nginx"
  pathtype: ImplementationSpecific
  hosts:
    - host: logstash-example.local
      paths:
        - path: /beats
          servicePort: 5044
        - path: /http
          servicePort: 8080
  tls: []
logstash更新:
[root@master01 logstash]# helm upgrade --install logstash -f values.yaml --namespace logging .
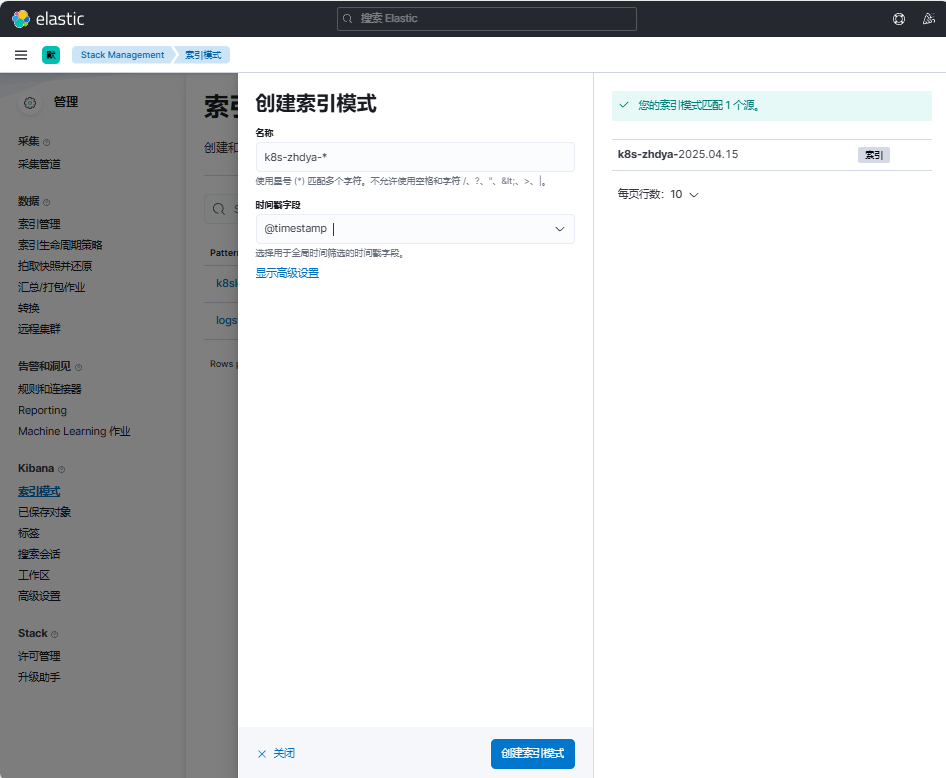
使用上面的 values 值更新 logstash,正常更新后上面的 counter 这个 Pod 日志会输出到一个名为 k8s-zhdya-2025.04.15 的索引去
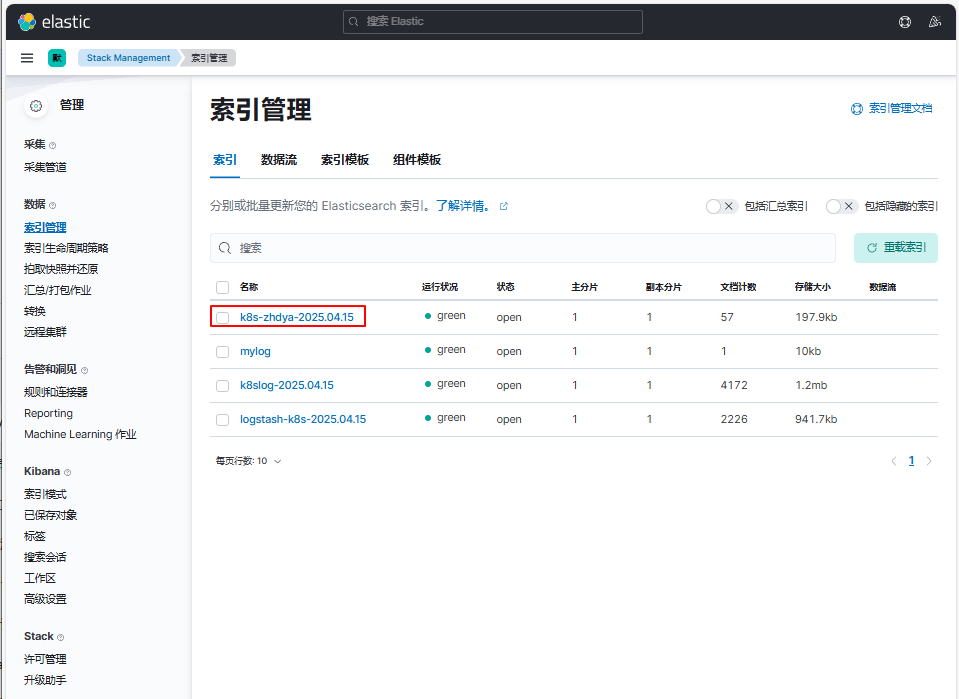
创建名为k8s-zhdya-*的索引模式,其中时间戳字段选择@timestamp
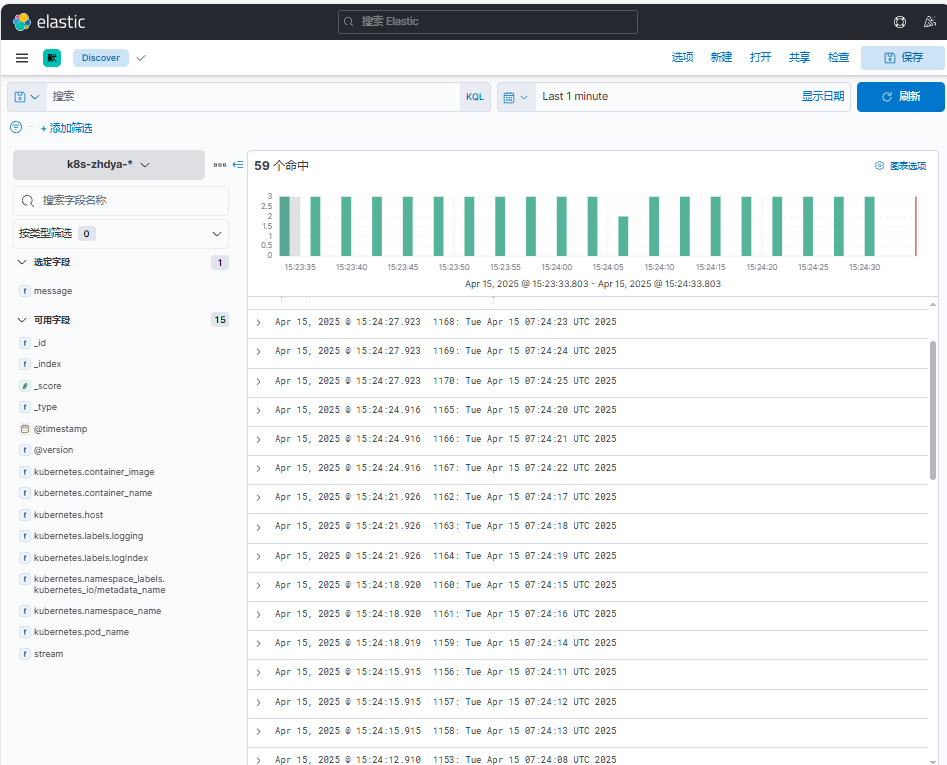
点击Discover,切换名为k8s-zhdya-*的索引模式。观察到可以查看到相关日志信息
这样我们就实现了自定义索引名称,当然你也可以使用 Pod 名称、容器名称、命名空间名称来作为索引的名称,这完全取决于你自己的需求。