

一、zbx配置详解
1.1 服务端配置
<colgroup> <col style="width: 50%" /> <col style="width: 50%" /> </colgroup>| 文件目录 | |
|---|---|
| /etc/zabbix/zabbix_server.conf | 配置文件 |
| /var/log/zabbix/zabbix_server.log | 当前放在/tmp/下面 |
| /usr/lib/systemd/system/zabbix-server.service | 手写的systemctl管理文件 如果yum、rpm安装自带 |
| /usr/local/share/zabbix/alertscripts/ | 用于实现告警的脚本 |
查看zbx配置文件
[root@zabbix-server01 ~]# grep '^[a-Z]' /etc/zabbix/zabbix_server.conf
LogFile=/var/log/zabbix/zabbix_server.log
DBName=zabbix
DBUser=zabbix
DBPassword=zabbix
Timeout=4
LogSlowQueries=3000
StatsAllowedIP=127.0.0.1
zbx配置文件详解
| ListenPort=10051 | 服务端端口 |
|---|---|
| LogFile=/var/log/zabbix/zabbix_server.log | 日志文件 |
| DBHost=localhost | 数据库地址 |
| DBName=zabbix | 数据库名字 |
| DBUser=zabbix | 数据库用户名 |
| DBPassword=zabbix | 数据库密码 |
| Timeout=4 | 超时时间 |
1.2 客户端配置
zbx客户端目录详解
| /etc/zabbix/zabbix_agent2.conf | 配置文件 |
|---|---|
| /etc/zabbix/zabbix_agent2.d/ | 子配置文件目录,用于自定义监控 |
| /var/log/zabbix | 日志 |
zbx客户端配置文件内容
| Server=172.16.1.41 | 指定服务端地址 |
|---|---|
1.3 zbx agent vs zbx agent2
| zbx agent分类 | zabbix agent | zabbix agent2 |
|---|---|---|
| 开发语言 | C语言 | Go语言和C语言 |
| 性能 | 独立进程方式运行 | 1个进程多线程技术运行, 减少资源消耗占用较少tcp资源,能够承受更高并发 |
二、常用键值与触发器函数
2.1 键值
2.1.1 常用键值
在监控项中使用,键值用于获取数据.
<colgroup> <col style="width: 50%" /> <col style="width: 50%" /> </colgroup>| 常用键值 | 说明 |
|---|---|
| agent.hostname | 主机名 获取的是客户端配置文件中指定的主机名 |
| system.hostname | 主机名 系统的主机名 类似于hostname |
| agent.ping | 服务端与客户端是否通畅 通1 不通非1 |
| net.if.in[if,] | 网络接口上传(进入)流量统计。返回 整数 if表示网卡名字 可以忽略。 |
| net.if.out[if,] | 流出流量统计。返回整数 |
| proc.num[,,,,] | 进程数。返回整数 name进程名字 user用户 state进程状态 cmdline进程对应的命令 |
| net.tcp.port[,port] | 检查是否能建立 TCP 连接到指定端口。 返回 0 - 不能连接;1 - 可以连接 |
案例演示:
#查看主机上僵尸进程(zomb)的数量
[root@zabbix-server01 ~]# zabbix_get -s 172.16.1.41 -p 10050 -k proc.num[,,zomb]
0
#查看eth0接口上的入站网络流量(字节为单位)
[root@zabbix-server01 ~]# zabbix_get -s 172.16.1.41 -p 10050 -k net.if.in[eth0,]
50156969
#检查nginx运行进程的数量
[root@zabbix-server01 ~]# zabbix_get -s 172.16.1.41 -p 10050 -k proc.num[nginx]
9
#检查端口80上是否有活动的TCP连接
[root@zabbix-server01 ~]# zabbix_get -s 172.16.1.41 -p 10050 -k net.tcp.port[,80]
1
2.1.2 zbx客户端键值
zbx客户端键值:https://www.zabbix.com/documentation/6.0/zh/manual/config/items/itemtypes/zabbix_agent
<colgroup> <col style="width: 50%" /> <col style="width: 50%" /> </colgroup>| 键值 | 名称 |
|---|---|
| agent.hostmetadata | Agent host metadata. Returns string |
| agent.hostname | 客户端主机名。返回字符串 |
| agent.ping | 客户端可达性检查。返回 nothing - 不可达;1 - 可达 |
| agent.variant | Agent variant check. Returns 1 - for Zabbix agent; 2 - for Zabbix agent 2 |
| agent.version | zabbix客户端(agent)的版本。返回字符串 |
| kernel.maxfiles | 操作系统最大的文件打开数量。返回整数 |
| kernel.maxproc | 操作系统最大的进程数。返回整数 |
| kernel.openfiles | Number of currently open file descriptors. Returns integer |
modbus.get[endpoint,, , ,,, ,] |
Reads modbus data. Returns various types |
net.dns.record[,name,, ,,] |
执行DNS查询。返回字符串信息 |
net.dns[,name,,, ,] |
检查 DNS 服务是否开启。返回 0 - DNS 服务关闭(服务未响应或DNS解析失败);1 - DNS 服务 开启 |
| net.if.collisions[if] | 网络冲突数量。返回整型 |
| net.if.discovery | List of network interfaces. Returns JSON |
| net.if.in[if,] | 网络接口上传流量统计。返回 整数 |
| net.if.list | 网络接口列表(包括接口类型,状态,IPv4地址,说明)。返回文本 |
| net.if.out[if,] | 上行流量统计。返回整数 |
| net.if.total[if,] | 网络接口上传下载的流量总和。返回整数 |
| net.tcp.listen[port] | 检查 TCP 端口 是否处于侦听状态。返回 0 - 未侦听;1 - 正在侦听 |
| net.tcp.port[,port] | 检查是否能建立 TCP 连接到指定端口。返回 0 - 不能连接;1 - 可以连接 |
| net.tcp.service.perf[service,,] | 检查 TCP 服务的性能,当服务 down 时返回 0,否则返回连接服务花费的秒数 |
| net.tcp.service[service,,] | 检查服务是否运行并接受 TCP 连接。返回 0 - 服务关闭;1 - 服务运行 |
net.tcp.socket.count[,, ,,] |
Returns number of TCP sockets that match parameters. Returns integer |
| net.udp.listen[port] | 检查UDP端口 是否处于侦听状态。返回 0 - 未侦听;1 - 正在侦听 |
| net.udp.service.perf[service,,] | 检查 UDP 服务的性能,当服务 down 时返回 0,否则返回连接到服务花费的秒数 |
| net.udp.service[service,,] | 检查服务是否运行并响应 UDP 请求。返回 0 - 服务关闭;1 - 服务运行 |
| net.udp.socket.count[,,,,] | Returns number of UDP sockets that match parameters. Returns integer |
| perf_counter[counter,] | 所有Windows计数器值。返回 整形、浮点、字符串、文本 |
| perf_counter_en[counter,] | Value of any Windows performance counter in English. Returns integer, float, string or text (depending on the request) |
| perf_instance.discovery[object] | List of object instances of Windows performance counters. Returns JSON |
| perf_instance_en.discovery[object] | List of object instances of Windows performance counters, discovered using object names in English. Returns JSON |
proc.cpu.util[,,, ,,] |
Process CPU utilization percentage. Returns float |
proc.mem[,,, ,] |
进程内存,以字节为单位。返回整数 |
proc.num[,,, ,] |
进程数。返回整数 |
| proc_info[process,,] | 具体处理的各个信息。返回浮点数 |
| sensor[device,sensor,] | 硬件传感器读数。返回浮点型 |
| service.info[service,] | 有关服务的信息。返回整数字段表示状态,启动状态;字符串 - 以字段作为显示名,路径,用户; 文 本 - 使用字段作为描述; 状态码:0 - 运行,1 - 暂停,2 - 启动挂起,3 - 暂停挂起,4 - 继续挂起,5 - 停止挂起,6 - 停止,7 - 未知,255 - 没有这个服务;启动码:0 - 自动,1 - 自动延迟,2 - 手动, 3 - 禁用,4 - 未知 |
| services[,,] | 列表服务。返回0表示空,如果是列表则是每行一个内容 |
| system.boottime | 系统启动时间。返回时间戳 |
| system.cpu.discovery | List of detected CPUs/CPU cores. Returns JSON |
| system.cpu.intr | 设备的中断数。返回整数 |
| system.cpu.load[,] | CPU 负载。返回浮点数 |
| system.cpu.num[] | CPU 数量,返回整数 |
| system.cpu.switches | 上下文的数量进行切换。它返回一个整数值。 |
system.cpu.util[,,, <logical_or_physical>] |
CPU utilization percentage. Returns float |
| system.hostname[,] | 系统主机名。返回字符串 |
| system.hw.chassis[] | 机架信息。返回字符串 |
| system.hw.cpu[,] | CPU 信息。返回字符串或整数 |
| system.hw.devices[] | PCI或者USB设备列表。返回文本 |
| system.hw.macaddr[,] | MAC地址。返回字符串 |
| system.localtime[] | System time. Returns integer with type as UTC; string - with type as local |
| system.run[command,] | 即在主机上指定的命令的执行。返回命令执行结果的文本值。如果指定NOWAIT的模式,这将返回执行 命令的结果1。 |
| system.stat[resource,] | 系统统计数据。返回整数值或者浮点值 |
| system.sw.arch | 软件架构信息。返回字符串 |
| system.sw.os[] | 操作系统信息。返回字符串 |
system.sw.packages[, ,] |
安装包列表。返回文本 |
| system.swap.in[,] | 在交换分区(swap)(从设备到内存)统计数据。返回整数 |
| system.swap.out[,] | 交换分区(从内存到设备)的统计数据。返回整数 |
| system.swap.size[,] | 交换分区空间大小,字节或从总百分比。从字节返回整数;对于浮动比例 |
| system.uname | 识别系统。返回 字符串 |
| system.uptime | 系统启动时间。返回整数 |
| system.users.num | 已登录的用户数量,返回整数 |
| vfs.dev.discovery | List of block devices and their type. Returns JSON |
| vfs.dev.read[,,] | 磁盘读取数据。类型是sectors, operations, bytes;返回整数,类型是 sps, ops, bps则返 回浮点。 |
| vfs.dev.write[,,] | 磁盘写入数据。类型是sectors, operations, bytes;返回整数,类型是 sps, ops, bps则返 回浮点。 |
vfs.dir.count[dir,<regex_incl>, <regex_excl>,<types_incl>, <types_excl>,<max_depth>, <min_size>,<max_size>,<min_age>, <max_age>,<regex_excl_dir>] |
目录递归的条目数量。返回整数 |
vfs.dir.get[dir,<regex_incl>, <regex_excl>,<types_incl>, <types_excl>,<max_depth>, <min_size>, <max_size>,<min_age>,<max_age>, <regex_excl_dir>] |
List of directory entries, recursively. Returns JSON |
vfs.dir.size[dir,<regex_incl>, <regex_excl>,,<max_depth>, <regex_excl_dir>] |
目录大小(bytes)。返回整数 |
| vfs.file.cksum[file,] | File checksum, calculated by the UNIX cksum algorithm. Returns integer for crc32 (default) and string for md5, sha256 |
| vfs.file.contents[file,] | 搜索文件内容。返回文本 |
vfs.file.exists[file,<types_incl>, <types_excl>] |
Checks if file exists. Returns 0 - not found; 1 - file of the specified type exists |
| vfs.file.get[file] | Information about a file. Returns JSON |
| vfs.file.md5sum[file] | 文件的MD5校验。返回字符串(该文件的MD5哈希值) |
| vfs.file.owner[file,,] | File owner information. Returns string |
| vfs.file.permissions[file] | Returns 4-digit string containing octal number with Unix permissions |
| vfs.file.regexp[file,regexp,,<start | line>,,] 查找文件中的字符串,返回内容是被匹配内容的整行字符串,或者其他可选参数 |
vfs.file.regmatch[file,regexp,, <start |
line>,] 查找文件中的字符串,如果有则返回1,没有则返回0。 |
| vfs.file.size[file,] | File size in bytes (default) or in newlines. Returns integer |
| vfs.file.time[file,] | 文件事件信息,返回的是时间戳 整数 |
| vfs.fs.discovery | List of mounted filesystems and their types. Returns JSON |
| vfs.fs.get | List of mounted filesystems, their types, disk space and inode statistics. Returns JSON |
| vfs.fs.inode[fs,] | 数或inode的百分比。返回数字,如果是浮点则是百分比 |
| vfs.fs.size[fs,] | 磁盘容量。如果返回的是字节则是整数,如果返回的是百分比则是浮点 |
| vm.memory.size[] | 从字节或总百分比的内存大小。它返回一个整数值,如果字节,只要百分比返回浮点值。 |
| vm.vmemory.size[] | 虚拟空间大小(以字节计)或百分比(总计)。 返回整型字节; 浮点百分比 |
| web.page.get[host,,] | 获取网页。返回信息为网页源码或者TXT |
| web.page.perf[host,,] | 全网页加载时间(秒)。返回浮点型 |
web.page.regexp[host,, ,regexp,,] |
查找网页中的字符串,返回内容是被匹配内容的整行字符串,或者其他可选参数 |
| wmi.get[,] | 执行 WMI 查询返回第一个对象。返回整形、浮点、字符串或者文本内容 |
| wmi.getall[,] | Execute WMI query and return the JSON document with all selected objects |
| zabbix.stats[,,queue,,] | Number of items in the queue which are delayed in Zabbix server or proxy by "from" till "to" seconds, inclusive. |
| zabbix.stats[,] | Returns a JSON object containing Zabbix server or proxy internal metrics. |
2.2 触发器函数
写在触发器表达式中,用于设置报警条件。触发器函数要结合键值(监控项)
| 功能(函数) | 说明 |
|---|---|
| 对比与比较 | |
| last() | 最近值 (最新的值),取出最近一些值 |
| nodata() | 是否有数据 |
| diff() | 是否发生变化 一般配合md5check() |
| 进行计算 | |
| avg() | 平均值 |
| min() | 最小值 |
| max() | 最大值 |
2.2.1 案例01 检查/etc/passwd的变化情况
倒数第1个md5的值和倒数第2个md5的是 如果不相等了,则报警。目的是用来检查/etc/passwd的变化情况,间接检查是否有用户增加或删除.
#倒数第1个 /etc/passwd 的md5值
last(/zabbix-client01/vfs.file.cksum[/etc/passwd,sha256],#1)
#倒数第2个 /etc/passwd 的md5值
last(/zabbix-client01/vfs.file.cksum[/etc/passwd,sha256],#2)
#完整表示式
last(/zabbix-client01/vfs.file.cksum[/etc/passwd,sha256],#1)<>last(/zabbix-client01/vfs.file.cksum[/etc/passwd,sha256],#2)
说明:默认系统自带此表达式
2.2.2 案例02 检查swap是否被使用(内存不足)
检查swap是否被使用(内存不足)的条件是:
-
条件1:swap总大小大于0(系统有swap)
-
条件2:swap当前使用的大小大于0(没有直接可以使用的监控项,这里调整为当前swap空闲率小于100)
#条件1:swap总大小大于0
last(/zabbix-client01/system.swap.size[,total])>0
#条件2:swap当前使用的大小大于0
last (/zabbix-client01/system.swap.size[,used])>0
#完整表达式
last(/zabbix-client01/system.swap.size[,total])>0 and last (/zabbix-client01/system.swap.size[,used])>0
三、自定义监控-参数案例
目标:检查指定用户是否存在异地登录。
思路:检查指定用户登录的ip地址。进行对比
<colgroup> <col style="width: 33%" /> <col style="width: 33%" /> <col style="width: 33%" /> </colgroup>| 步骤 | 流程 | 说明 |
|---|---|---|
| 客户端 | linux: 通过命令、脚本取出对应的值 | |
| linux:根据zbx要求按照格式,书写配置文件,创建键值 | 键值key用于获取客户端数据 | |
| linux:重启客户端客户端测试键值是否可用 | zabbix_agent2 -t | |
| 服务端 | linux:服务端测试键值是否可用 | zabbix_get |
| Web界面 | 键值与监控项关联 | |
| 测试 | ||
| 触发器 | 是否发出警告 需要根据情况决定是否设置 |
3.1 客户端
1、在客户端上书写键值key
[root@zabbix-client01 ~]# vim /etc/zabbix/zabbix_agent2.d/web.conf
UserParameter=ngx.port,ss -lntup|grep -w 80|wc -l
UserParameter=user.login[*],lastlog -u "$1" |awk 'NR==2{print $$3}'
注意:如果使用自定义键值传参,awk取列的时候要使用\$\$列。
2、重启客户端
| [root@zabbix-client01 ~]# systemctl restart zabbix-agent2.service |
|---|
3、客户端本地测试键值
[root@zabbix-client01 ~]# zabbix_agent2 -t user.login
user.login [s|192.168.1.108]
3.2 服务端
在服务端测试键值
[root@zabbix-server01 ~]# yum install -y zabbix_get
[root@zabbix-server01 ~]# zabbix_get -s 172.16.1.41 -k user.login[root]
192.168.1.108
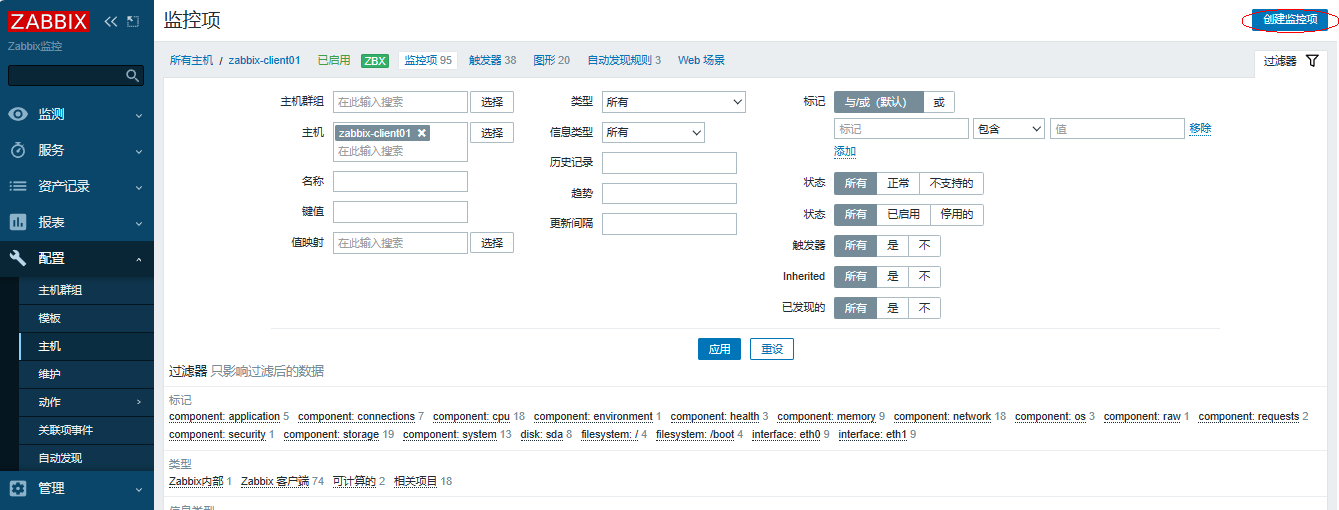
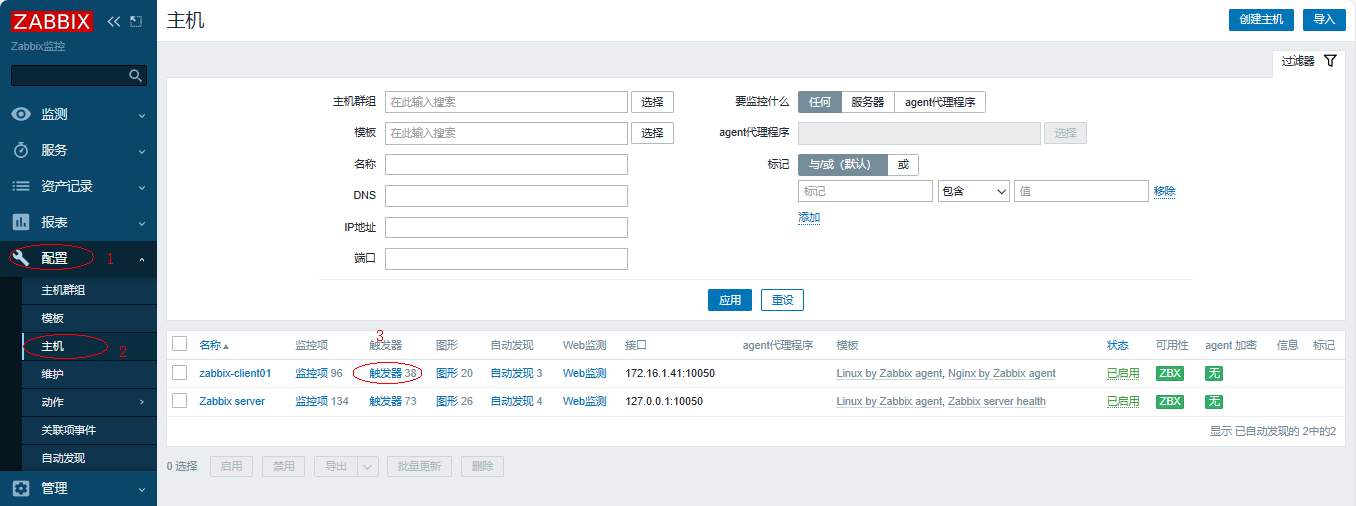
3.3 web界面调试
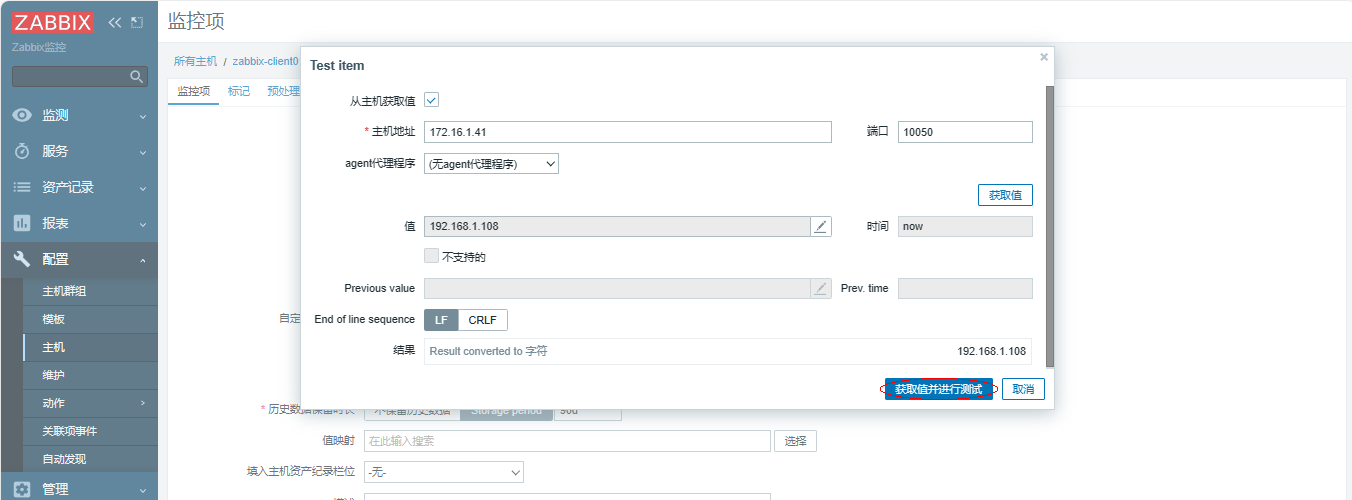
1、添加监控项

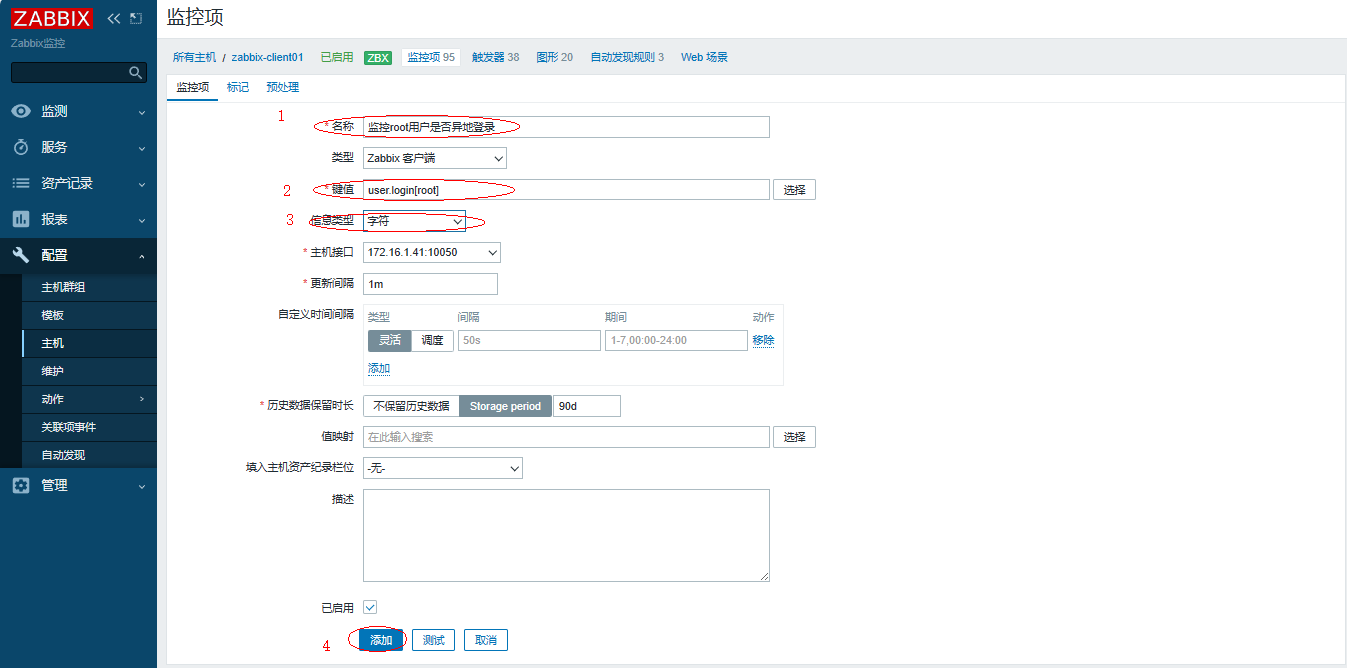
进行测试
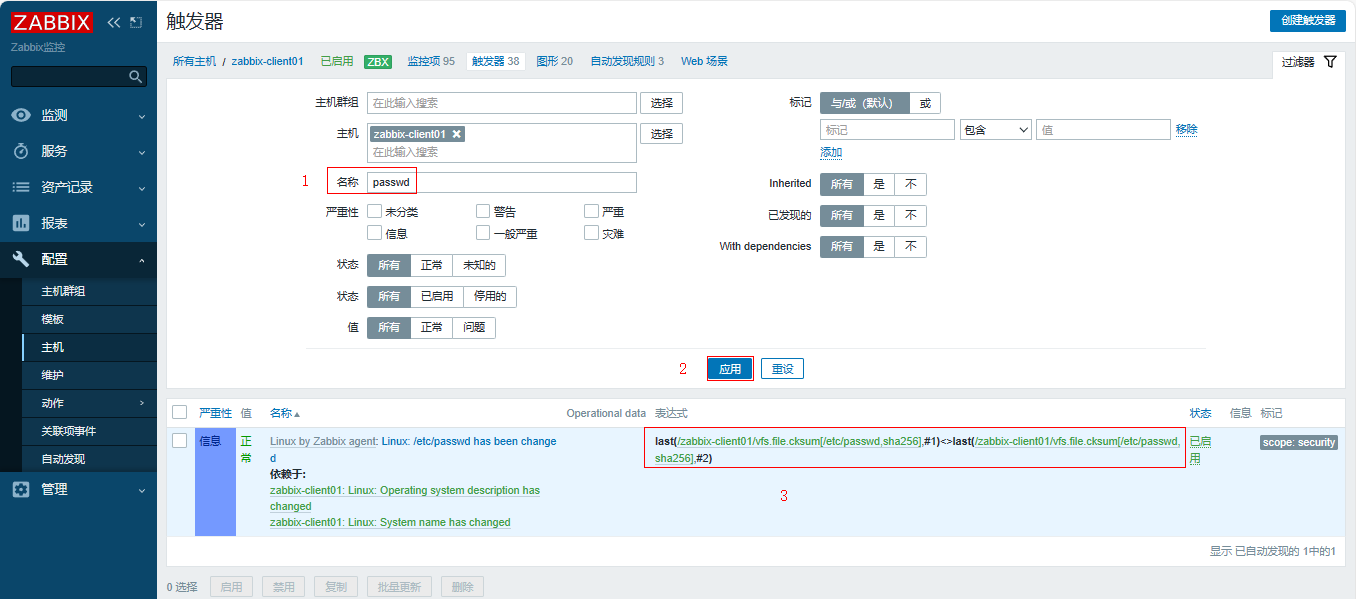
2、添加触发器
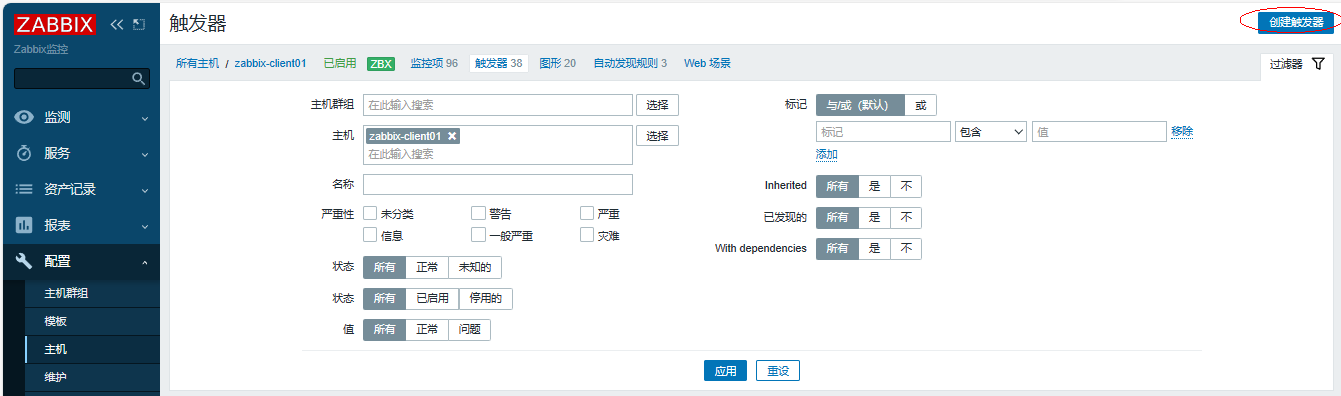
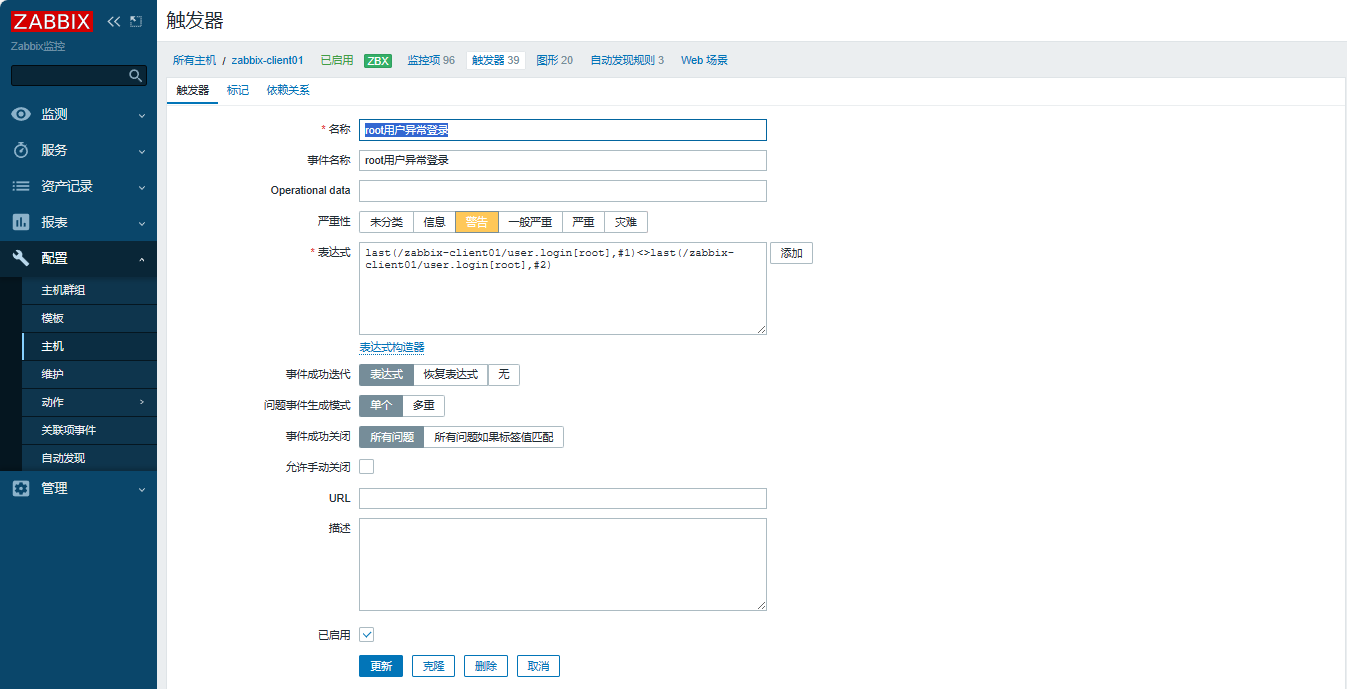
定义名称、表达式
#定义名称
root用户异常登录
#定义表达式
last(/zabbix-client01/user.login[root],#1)<>last(/zabbix-client01/user.login[root],#2)
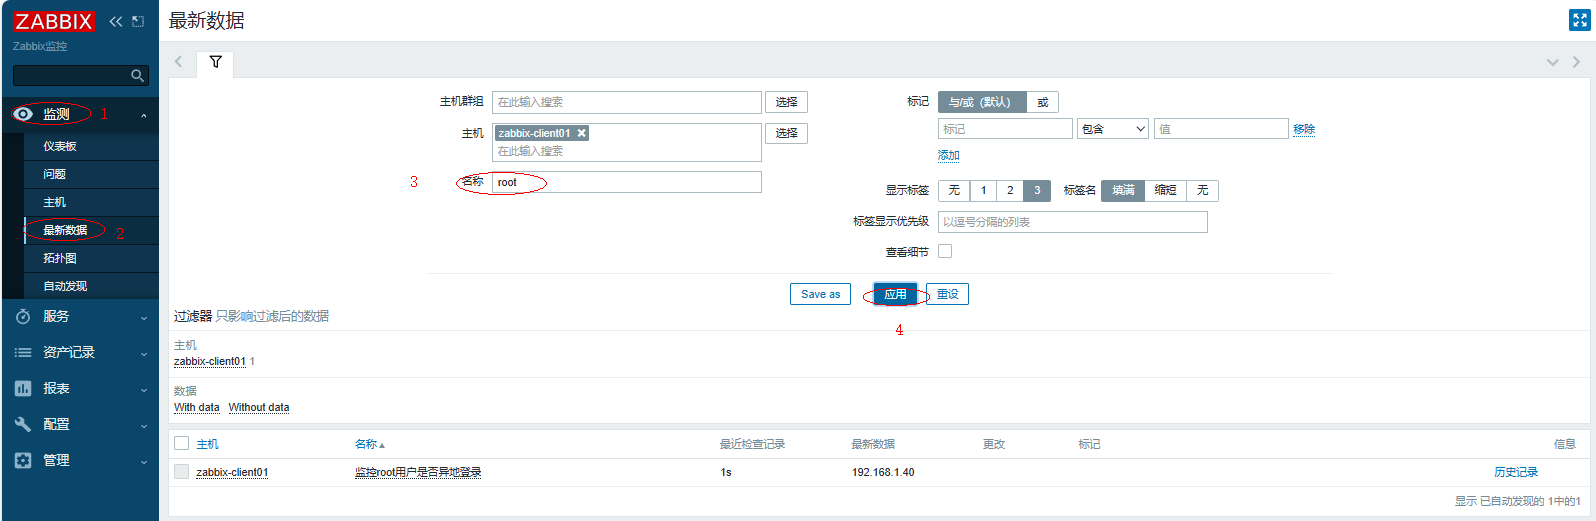
3、查看最新数据
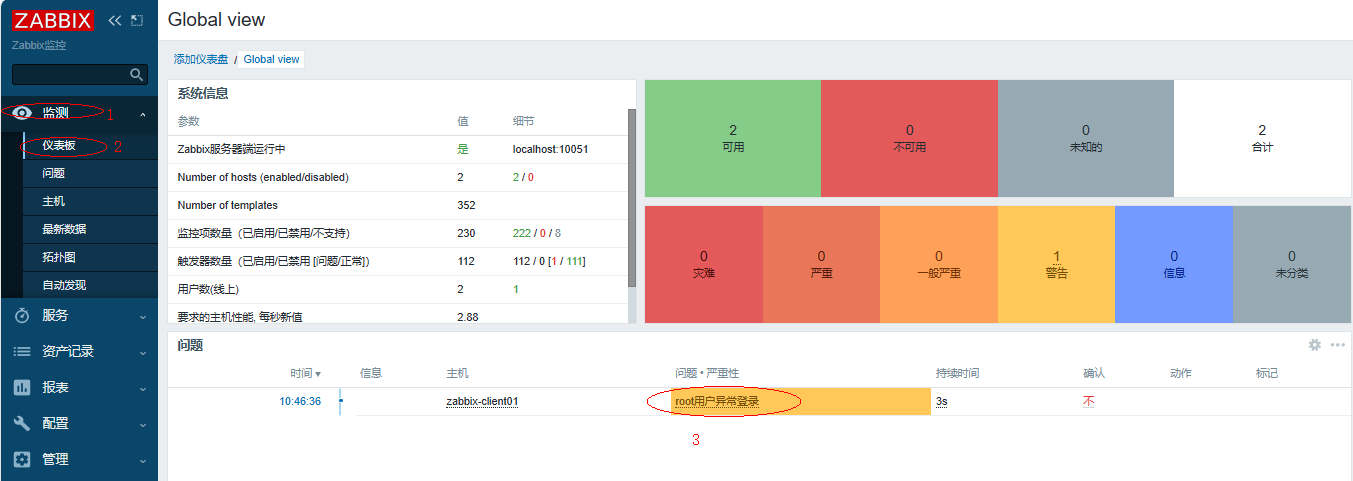
4、模拟告警
1、先在本地使用xshell连接客户端172.168.1.41,再在服务端172.168.1.40上连接客户端172.168.1.41
2、查看仪表板,观察到报警信息,过一会判断一致就会报警消失
四、使用模板
通过创建自定义模板实现,监控项,触发器,图形批量使用。
步骤:
-
创建模板
-
添加自定义监控项
-
添加触发器
-
添加图形
-
模板关联主机
-
客户端配置自定义键值
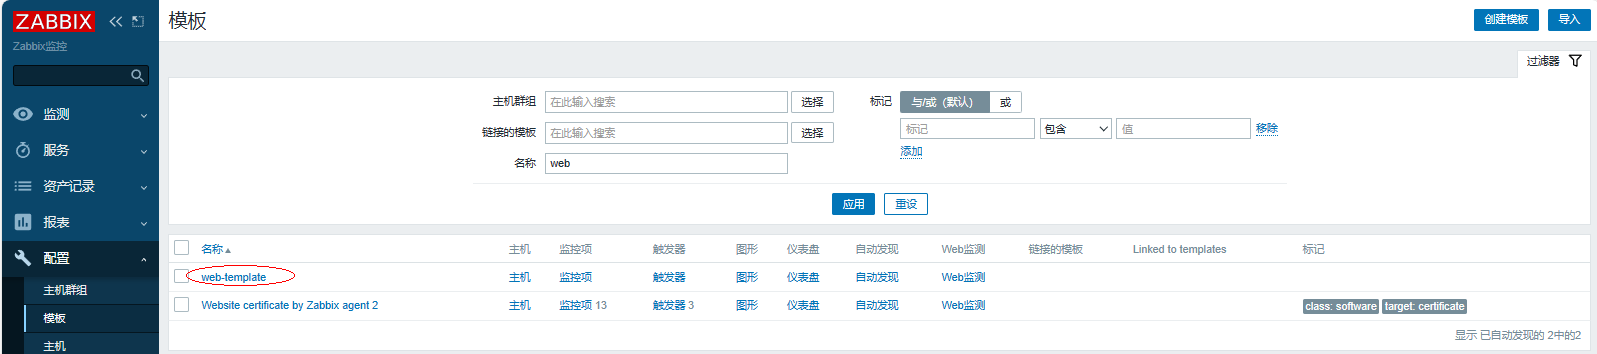
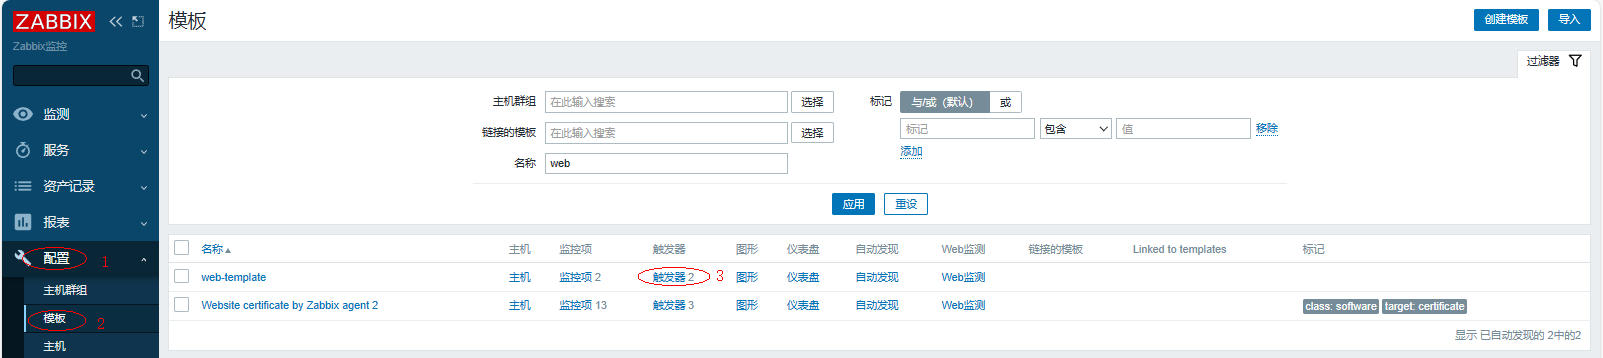
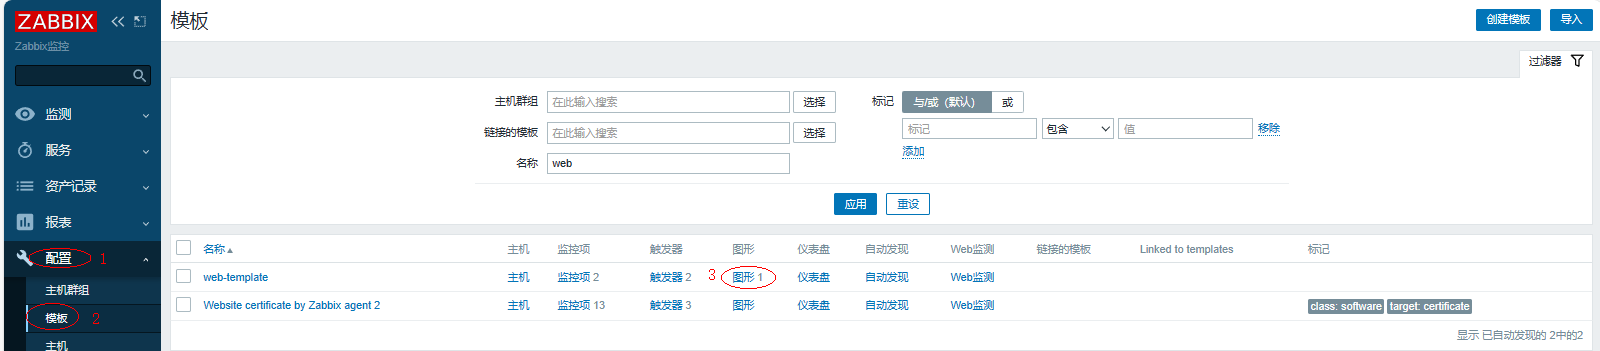
1、创建模板
定义模板名称

查看创建好的模板文件
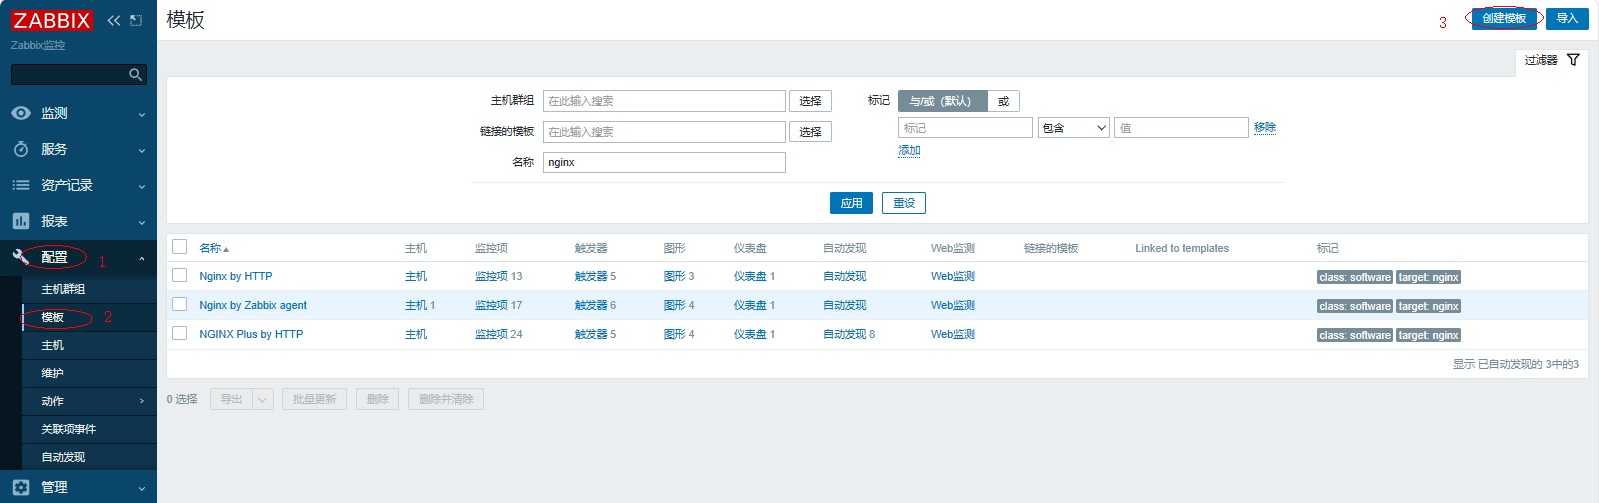
2、添加自定义监控项
复制主机的监控项
勾选相关的监控项
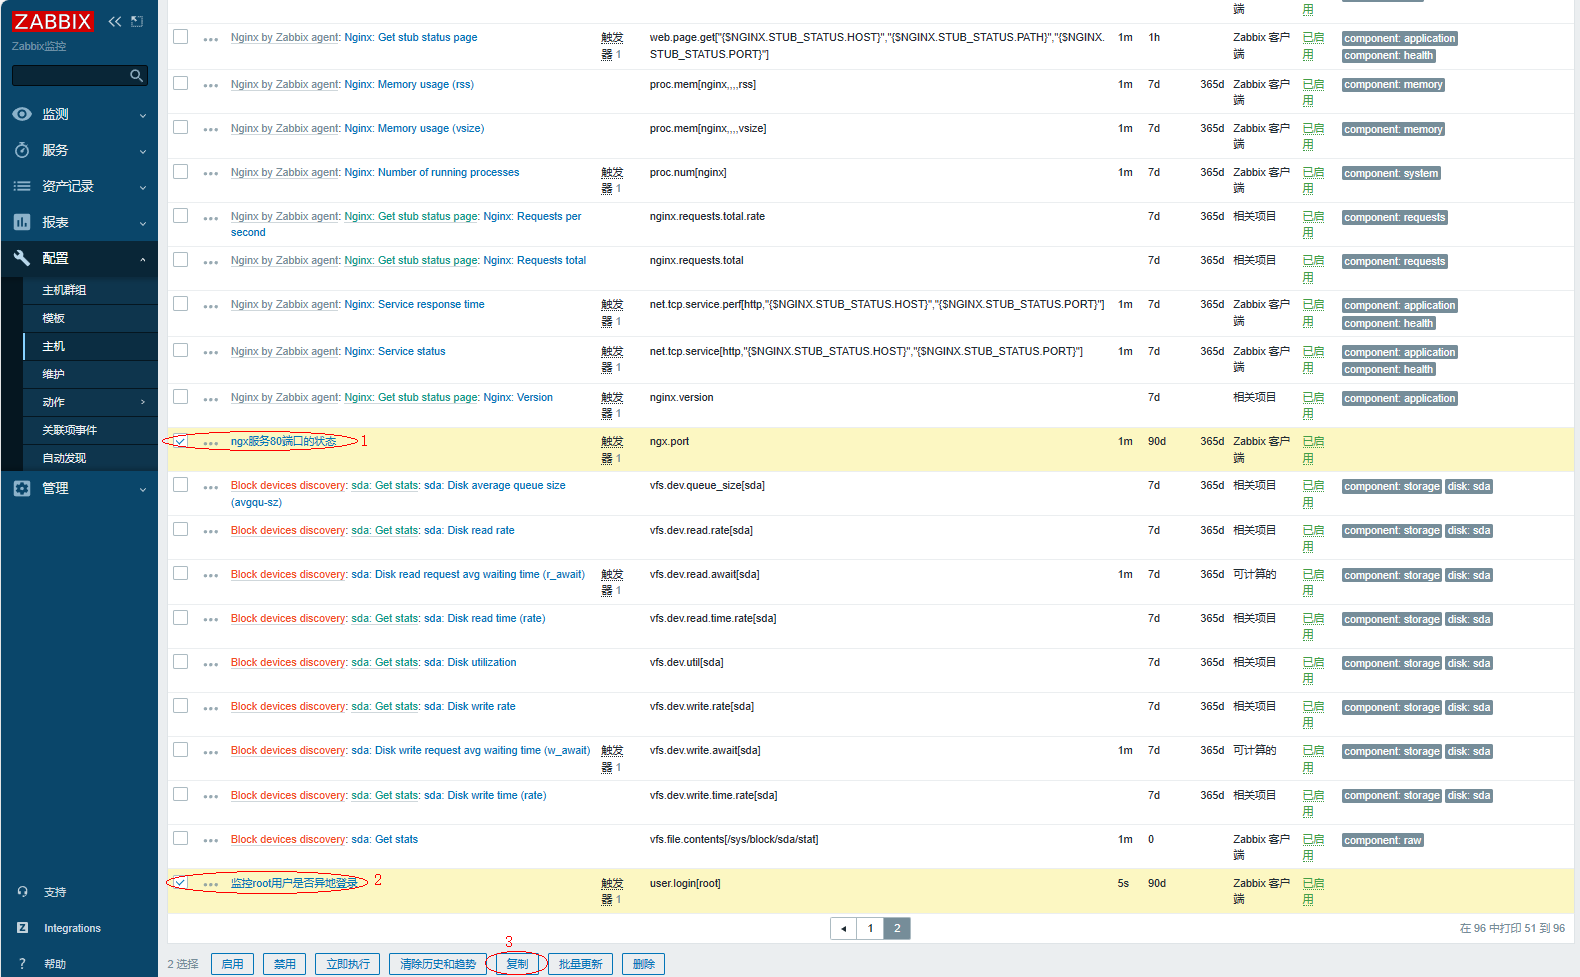
复制即可

查看复制的监控项

3、添加触发器
复制主机的触发器

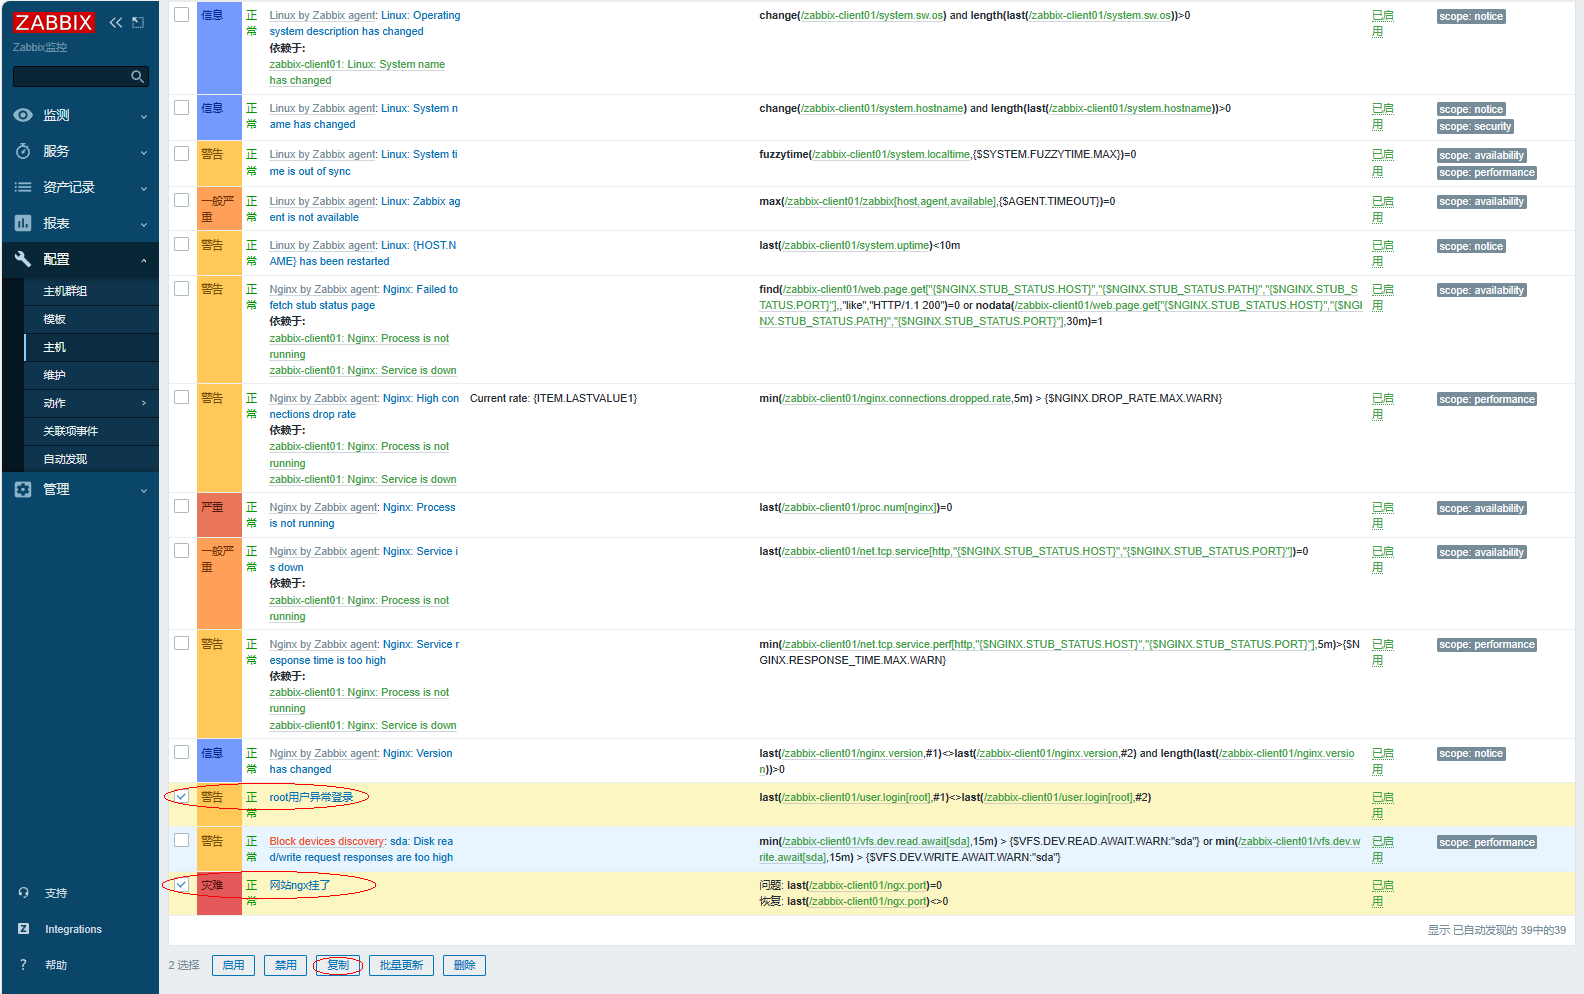

查看复制的结果
4、添加图形
复制主机的图形
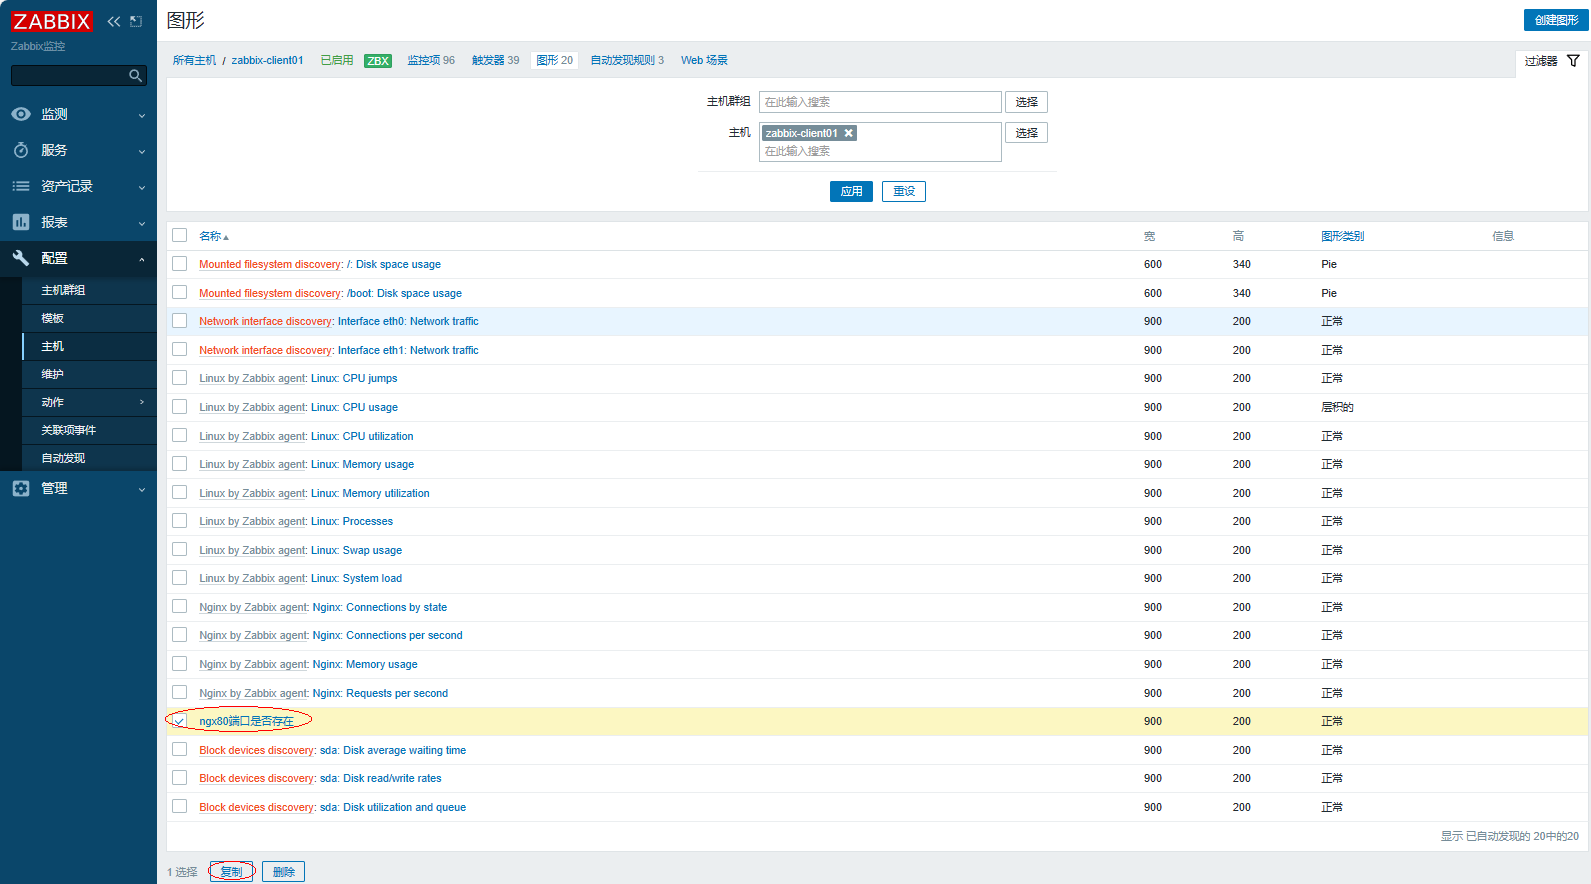

查看复制的结果
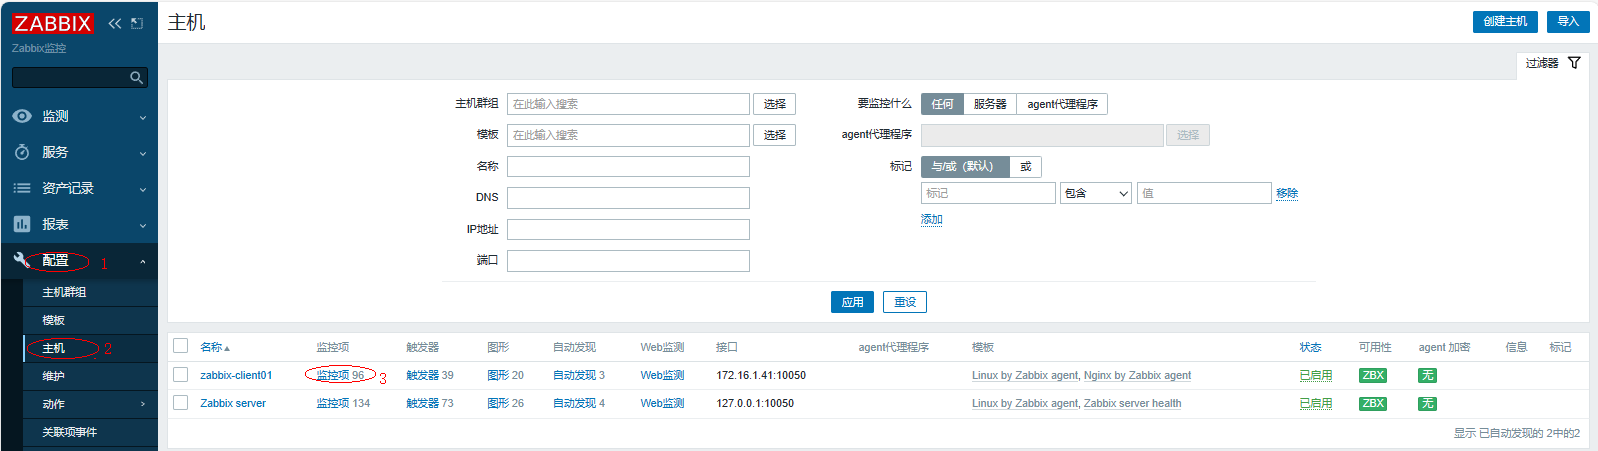
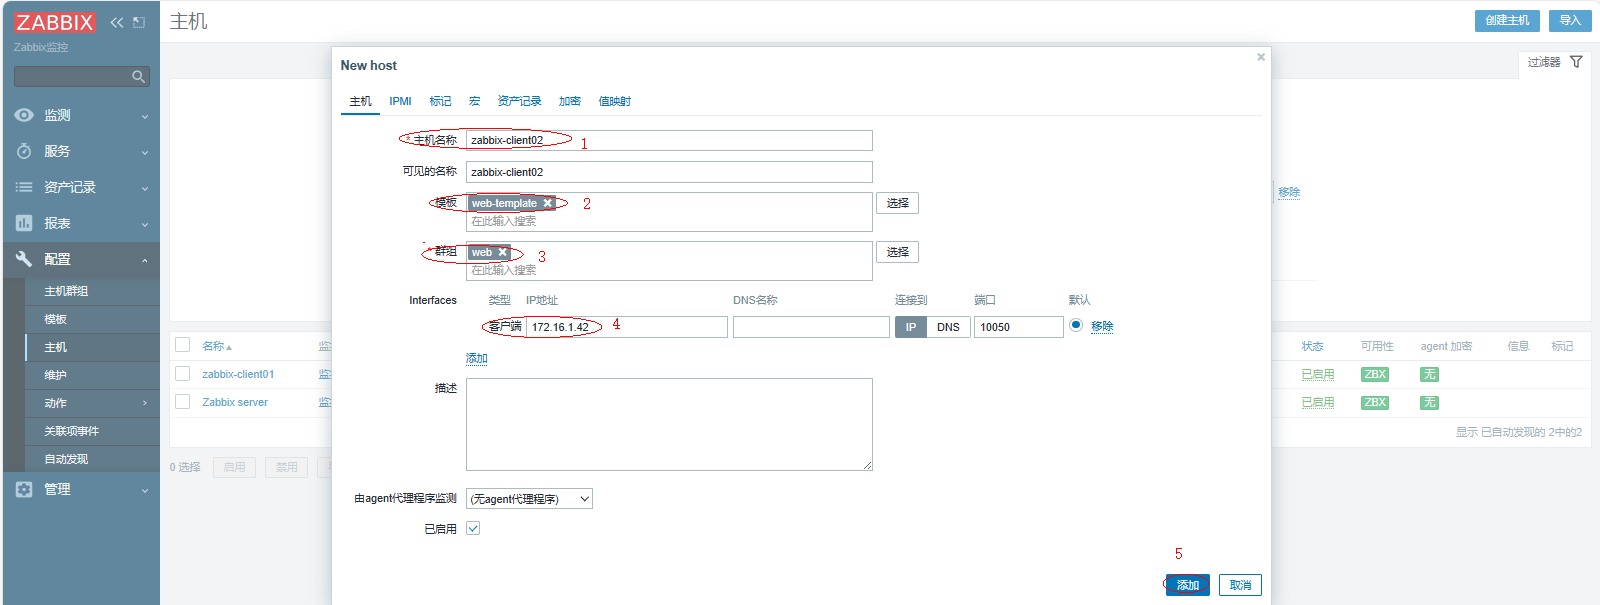
5、模板关联主机
在此需要提前配置好客户端主机,详情参考4.2配置客户端
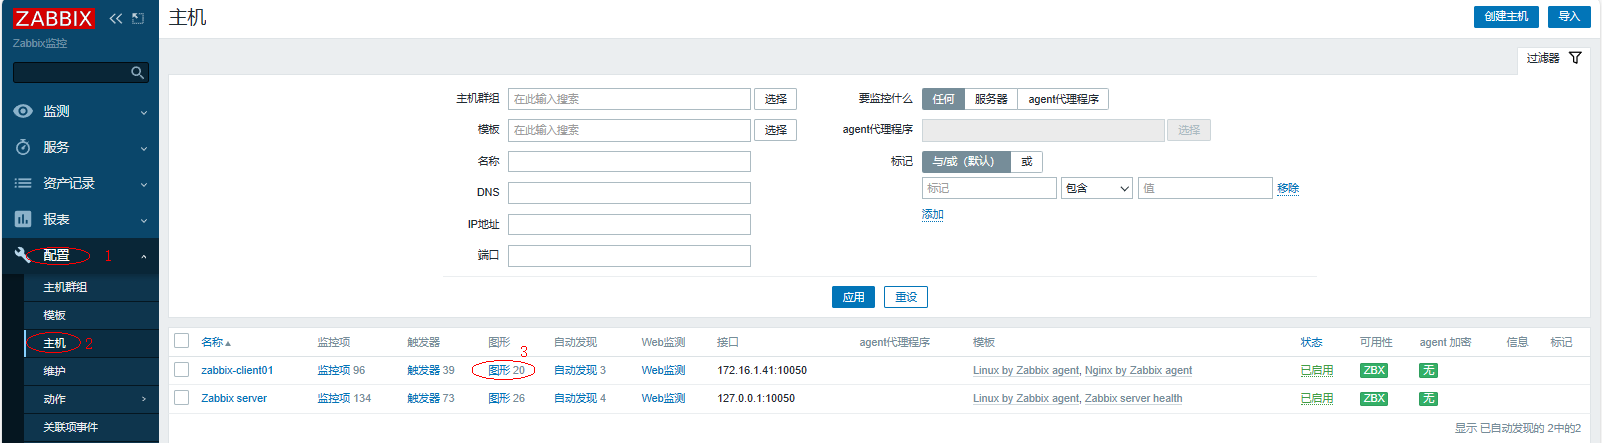
添加新的主机

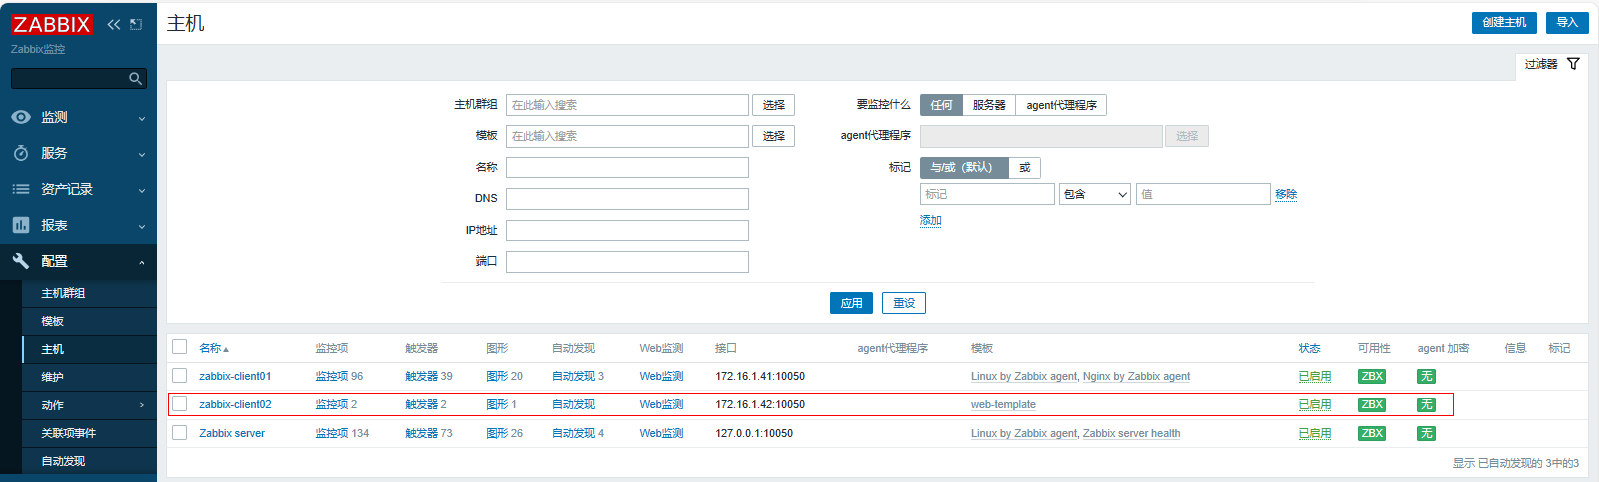
查看结果,添加模板关联主机成功
6、客户端配置自定义键值
[root@zabbix-client02 ~]# vim /etc/zabbix/zabbix_agent2.d/web.conf
UserParameter=ngx.port,ss -lntup|grep -w 80|wc -l
UserParameter=user.login[*],lastlog -u "$1" |awk 'NR==2{print $$3}'
重启客户端
| [root@zabbix-client02 ~]# systemctl restart zabbix-agent2.service |
|---|