
一、自定义资源
Prometheus-operator 通过定期循环watch apiserver,获取到CRD资源(比如 servicemonitor)的创建或者更新,将配置更新及时应用到运行中的prometheus pod 中转换成标准promethesu配置文件供prometheus server使用。
各个CRD以及operator之间的关系:
使用CRD做prometheus配置,"匹配"是一个很重要的细节,详细匹配关系如图,任何 地方匹配失败会导致转化成的标配prometheus文件无法识别到targets。

Prometheus Operater 定义了如下的四类自定义资源:
- Prometheus
- ServiceMonitor
- Alertmanager
- PrometheusRule
1.1 Prometheus
Prometheus 自定义资源(CRD)声明了在 Kubernetes 集群中运行的 Prometheus 的 期望设置。包含了副本数量,持久化存储,以及 Prometheus 实例发送警告到的 Alertmanagers等配置选项。
每一个 Prometheus 资源,Operator 都会在相同 namespace 下部署成一个正确配置 的 StatefulSet,Prometheus 的 Pod 都会挂载一个名为 的 Secret,里面包含了 Prometheus 的配置。Operator 根据包含的 ServiceMonitor 生成配置,并且更新含有 配置的 Secret。无论是对 ServiceMonitors 或者 Prometheus 的修改,都会持续不断的 被按照前面的步骤更新。
示例配置如下:
kind: Prometheus
metadata: # 略
spec:
  alerting:
    alertmanagers:
    - name: prometheus-prometheus-oper-alertmanager # 定义该 Prometheus对接的Alertmanager集群的名字, 在default这个namespace中
      namespace: default
      pathPrefix: /
      port: web
  baseImage: quay.io/prometheus/prometheus
  replicas: 2 #定义该 Proemtheus “集群”有两个副本
  ruleSelector: #定义这个Prometheus需要使用带有prometheus=k8s且 role=alert-rules标签的PrometheusRule
    matchLabels:
      prometheus: k8s
      role: alert-rules
  serviceMonitorNamespaceSelector: {} #定义这些 Prometheus 在哪些 namespace里寻找ServiceMonitor
  serviceMonitorSelector: #定义这个Prometheus需要使用带有 k8s-app=node-exporter标签的ServiceMonitor,不声明则会全部选中
    matchLabels:
      k8s-app: node-exporter
  version: v2.10.0
1.2 ServiceMonitor
ServiceMonitor 自定义资源(CRD)能够声明如何监控一组动态服务的定义。它使用标签 选择定义一组需要被监控的服务。这样就允许组织引入如何暴露 metrics 的规定,只要符合这些规定新服务就会被发现列入监控,而不需要重新配置系统。
要想使用 Prometheus Operator 监控 Kubernetes 集群中的应用,Endpoints 对象必 须存在。Endpoints 对象本质是一个 IP 地址列表。通常,Endpoints 对象由 Service 构建。Service 对象通过对象选择器发现 Pod 并将它们添加到 Endpoints 对象中。
Prometheus Operator 引入 ServiceMonitor 对象,它发现 Endpoints 对象并配置 Prometheus 去监控这些 Pods。
ServiceMonitorSpec 的 endpoints 部分用于配置需要收集 metrics 的 Endpoints 的端 口和其他参数。
注意:endpoints(小写)是 ServiceMonitor CRD 中的一个字段,而 Endpoints(大写)是 Kubernetes 资源类型。
ServiceMonitor 和发现的目标可能来自任何 namespace:
-
使用 PrometheusSpec 下 ServiceMonitorNamespaceSelector, 通过各自 Prometheus server 限制 ServiceMonitors 作用 namespece。
-
使用 ServiceMonitorSpec 下的 namespaceSelector 允许发现 Endpoints 对象的命名空间。要发现所有命名空间下的目标,namespaceSelector 必须为空。
spec:
  namespaceSelector:
    any: true
示例配置如下:
apiVersion: monitoring.coreos.com/v1
kind: ServiceMonitor
metadata:
  labels:
    k8s-app: node-exporter # 这个ServiceMonitor对象带有k8s-app=node-exporter标签,因此会被Prometheus选中
    name: ingress-nginx
    namespace: monitoring
spec:
  endpoints:
  - interval: 15s       # 定义这些Endpoints需要每15秒抓取一次
    port: prometheus        # 这边一定要用svc中port的name。
  namespaceSelector:
    matchNames:
    - ingress-nginx         # 选定抓取的指定namespace
  selector:
    matchLabels:        # 匹配的抓取标签
      app.kubernetes.io/component: controller
      app.kubernetes.io/instance: ingress-nginx
      app.kubernetes.io/name: ingress-nginx
      app.kubernetes.io/part-of: ingress-nginx
      app.kubernetes.io/version: 1.7.0
1.3 Alertmanager
Alertmanager 自定义资源(CRD)声明在 Kubernetes 集群中运行的 Alertmanager 的期 望设置。它也提供了配置副本集和持久化存储的选项。
每一个 Alertmanager 资源,Operator 都会在相同 namespace 下部署成一个正确配置 的 StatefulSet。Alertmanager pods 配置挂载一个名为 的 Secret, 使用 alertmanager.yaml key 对作为配置文件。
当有两个或更多配置的副本时,Operator 可以高可用性模式运行Alertmanager实例。 示例配置如下:
示例配置如下:
kind: Alertmanager #一个Alertmanager对象
metadata:
  name: prometheus-prometheus-oper-alertmanager
spec:
  baseImage: quay.io/prometheus/alertmanager
  replicas: 3      #定义该Alertmanager集群的节点数为3
  version: v0.17.0
1.4 PrometheusRule
PrometheusRule CRD 声明一个或多个 Prometheus 实例需要的 Prometheus rule。
Alerts 和 recording rules 可以保存并应用为 yaml 文件,可以被动态加载而不需要重启。
示例配置如下:
kind: PrometheusRule
metadata:
  labels: #定义该PrometheusRule的label, 显然它会被Prometheus选中
    prometheus: k8s
    role: alert-rules
  name: prometheus-k8s-rules
spec:
  groups:
  - name: k8s.rules
    rules: #定义了一组规则,其中只有一条报警规则,用来报警kubelet是不是挂了
    - alert: KubeletDown
      annotations:
        message: Kubelet has disappeared from Prometheus target discovery.
      expr: |
        absent(up{job="kubelet"} == 1)
      for: 15m
      labels:
        severity: critical
1.5 配置间的匹配总结
ServiceMonitor 注意事项:
- ServiceMonitor 的 label 需要跟prometheus中定义serviceMonitorSelector一致。
- ServiceMonitor 的 endpoints 中 port 时对应k8s service资源中的portname , 不是 port number。
- ServiceMonitor 的 selector.matchLabels 需要匹配k8s service中的 label。
- ServiceMonitor 资源创建在 prometheus 的 namespace 下,使用namespaceSelector匹配要监控的k8s svc的ns。
- servicemonitor 若匹配多个 svc ,会发生数据重复。
二、抓取自定义资源 -- Ingress-nginx(Helm)
2.1 暴露ingress的监控端口
通过 helm 部署维护的 ingress-nginx
vim values.yaml
...
...
  metrics:
    port: 10254
    portName: metrics
    # if this port is changed, change healthz-port: in extraArgs: accordingly
    enabled: true
    service:
      annotations:
        prometheus.io/scrape: "true"
        prometheus.io/port: "10254"
···
    prometheusRule:
      enabled: true
      additionalLabels: {}
      namespace: "monitoring"

[root@master01 ~]# cd /root/6/ingress-nginx/
[root@master01 ingress-nginx]# vim values.yaml
# 修改第655行,将enabled: false修改为enabled: true
655     enabled: true
# 修改第657行,将annotations: {}修改为annotations:
657       annotations:
# 取消注释第658行和第659行
658       prometheus.io/scrape: "true"
659       prometheus.io/port: "10254"
# 修改第691行,将enabled: false修改为enabled: true
691       enabled: true
# 修改第693行,指定namespace: "monitoring"
693       namespace: "monitoring"
# 修改694行内容并在后面添加规则
      rules:
        - alert: NginxFailedReload
          expr: nginx_ingress_controller_config_last_reload_successful == 0
          for: 1m
          labels:
            severity: critical
          annotations:
            summary: "Nginx配置重载失败"
            description: "Nginx Ingress Controller配置重载失败,实例: {{ $labels.instance }}"

        - alert: HighHttp4xxRate
          expr: |
            sum(rate(nginx_ingress_controller_requests{status=~"4.."}[5m])) by (host, namespace)
            /
            sum(rate(nginx_ingress_controller_requests[5m])) by (host, namespace)
            * 100 > 5  # 调整为5%阈值
          for: 5m
          labels:
            severity: warning
          annotations:
            summary: "HTTP 4xx错误率过高 ({{ $value }}%)"
            description: "命名空间 {{ $labels.namespace }} 主机 {{ $labels.host }}"

        - alert: HighHttp5xxRate
          expr: |
            sum(rate(nginx_ingress_controller_requests{status=~"5.."}[5m])) by (host, namespace)
            /
            sum(rate(nginx_ingress_controller_requests[5m])) by (host, namespace)
            * 100 > 1
          for: 2m
          labels:
            severity: critical
          annotations:
            summary: "HTTP 5xx错误率过高 ({{ $value }}%)"
            description: "命名空间 {{ $labels.namespace }} 主机 {{ $labels.host }}"

        - alert: HighLatency
          expr: |
            histogram_quantile(0.99,
              sum by (le, host, namespace) (
                rate(nginx_ingress_controller_request_duration_seconds_bucket[2m])
              )
            ) > 2  # 调整为2秒阈值
          for: 5m
          labels:
            severity: warning
          annotations:
            summary: "高延迟请求 (p99: {{ $value }}秒)"
            description: "命名空间 {{ $labels.namespace }} 主机 {{ $labels.host }}"

        - alert: HighRequestRate
          expr: |
            sum(rate(nginx_ingress_controller_requests[5m])) by (instance) > 5000  # 使用正确指标
          for: 5m
          labels:
            severity: warning
          annotations:
            summary: "高请求速率 ({{ $value }} req/s)"
            description: "实例 {{ $labels.instance }}"

        - alert: SSLCertExpiring15d
          expr: |
            nginx_ingress_controller_ssl_expire_time_seconds < 1296000  # 15天
          for: 1h
          labels:
            severity: warning
          annotations:
            summary: "SSL证书即将过期 ({{ $labels.host }})"
            description: "证书 {{ $labels.secret_name }} 将在15天内过期 (剩余: {{ $value | humanizeDuration }})"

        - alert: SSLCertExpiring7d
          expr: |
            nginx_ingress_controller_ssl_expire_time_seconds < 604800  # 7天
          for: 1h
          labels:
            severity: critical
          annotations:
            summary: "SSL证书即将过期 ({{ $labels.host }})"
            description: "证书 {{ $labels.secret_name }} 将在7天内过期 (剩余: {{ $value | humanizeDuration }})"

# 完整配置文件
[root@master01 ingress-nginx]# egrep -v "#|^$" values.yaml
commonLabels: {}
controller:
  name: controller
  image:
    chroot: false
    registry: registry.cn-hangzhou.aliyuncs.com
    image: google_containers/nginx-ingress-controller
    tag: "v1.7.0"
    digestChroot: sha256:e84ef3b44c8efeefd8b0aa08770a886bfea1f04c53b61b4ba9a7204e9f1a7edc
    pullPolicy: IfNotPresent
    runAsUser: 101
    allowPrivilegeEscalation: true
  existingPsp: ""
  containerName: controller
  containerPort:
    http: 80
    https: 443
  config:
    load-balance: "round_robin"
  configAnnotations: {}
  proxySetHeaders: {}
  addHeaders: {}
  dnsConfig: {}
  hostname: {}
  dnsPolicy: ClusterFirstWithHostNet
  reportNodeInternalIp: false
  watchIngressWithoutClass: false
  ingressClassByName: false
  enableTopologyAwareRouting: false
  allowSnippetAnnotations: true
  hostNetwork: true
  hostPort:
    enabled: false
    ports:
      http: 80
      https: 443
  electionID: ""
  ingressClassResource:
    name: nginx
    enabled: true
    default: false
    controllerValue: "k8s.io/ingress-nginx"
    parameters: {}
  ingressClass: nginx
  podLabels: {}
  podSecurityContext: {}
  sysctls: {}
  publishService:
    enabled: true
    pathOverride: ""
  scope:
    enabled: false
    namespace: ""
    namespaceSelector: ""
  configMapNamespace: ""
  tcp:
    configMapNamespace: ""
    annotations: {}
  udp:
    configMapNamespace: ""
    annotations: {}
  maxmindLicenseKey: ""
  extraArgs: {}
  extraEnvs: []
  kind: DaemonSet
  annotations: {}
  labels: {}
  updateStrategy: {}
  minReadySeconds: 0
  tolerations: []
  affinity: {}
  topologySpreadConstraints: []
  terminationGracePeriodSeconds: 300
  nodeSelector:
    kubernetes.io/os: linux
    ingress: "true"
  livenessProbe:
    httpGet:
      path: "/healthz"
      port: 10254
      scheme: HTTP
    initialDelaySeconds: 10
    periodSeconds: 10
    timeoutSeconds: 1
    successThreshold: 1
    failureThreshold: 5
  readinessProbe:
    httpGet:
      path: "/healthz"
      port: 10254
      scheme: HTTP
    initialDelaySeconds: 10
    periodSeconds: 10
    timeoutSeconds: 1
    successThreshold: 1
    failureThreshold: 3
  healthCheckPath: "/healthz"
  healthCheckHost: ""
  podAnnotations: {}
  replicaCount: 1
  minAvailable: 1
  resources:
    requests:
      cpu: 100m
      memory: 90Mi
  autoscaling:
    apiVersion: autoscaling/v2
    enabled: false
    annotations: {}
    minReplicas: 1
    maxReplicas: 11
    targetCPUUtilizationPercentage: 50
    targetMemoryUtilizationPercentage: 50
    behavior: {}
  autoscalingTemplate: []
  keda:
    apiVersion: "keda.sh/v1alpha1"
    enabled: false
    minReplicas: 1
    maxReplicas: 11
    pollingInterval: 30
    cooldownPeriod: 300
    restoreToOriginalReplicaCount: false
    scaledObject:
      annotations: {}
    triggers: []
    behavior: {}
  enableMimalloc: true
  customTemplate:
    configMapName: ""
    configMapKey: ""
  service:
    enabled: true
    appProtocol: true
    annotations: {}
    labels: {}
    externalIPs: []
    loadBalancerIP: ""
    loadBalancerSourceRanges: []
    enableHttp: true
    enableHttps: true
    ipFamilyPolicy: "SingleStack"
    ipFamilies:
      - IPv4
    ports:
      http: 80
      https: 443
    targetPorts:
      http: http
      https: https
    type: LoadBalancer
    nodePorts:
      http: ""
      https: ""
      tcp: {}
      udp: {}
    external:
      enabled: true
    internal:
      enabled: false
      annotations: {}
      loadBalancerSourceRanges: []
  shareProcessNamespace: false
  extraContainers: []
  extraVolumeMounts: []
  extraVolumes: []
  extraInitContainers:
  - name: sysctl
    image: registry.cn-hangzhou.aliyuncs.com/abroad_images/alpine:3.10
    imagePullPolicy: IfNotPresent
    command:
      - sh
      - -c
      - |
        mount -o remount rw /proc/sys
        sysctl -w net.core.somaxconn=65535
        sysctl -w net.ipv4.tcp_tw_reuse=1
        sysctl -w net.ipv4.ip_local_port_range="1024 65535"
        sysctl -w fs.file-max=1048576
        sysctl -w fs.inotify.max_user_instances=16384
        sysctl -w fs.inotify.max_user_watches=524288
        sysctl -w fs.inotify.max_queued_events=16384
    securityContext:
      privileged: true
  extraModules: []
  opentelemetry:
    enabled: false
    image: registry.k8s.io/ingress-nginx/opentelemetry:v20230312-helm-chart-4.5.2-28-g66a760794@sha256:40f766ac4a9832f36f217bb0e98d44c8d38faeccbfe861fbc1a76af7e9ab257f
    containerSecurityContext:
      allowPrivilegeEscalation: false
  admissionWebhooks:
    annotations: {}
    enabled: true
    extraEnvs: []
    failurePolicy: Fail
    port: 8443
    certificate: "/usr/local/certificates/cert"
    key: "/usr/local/certificates/key"
    namespaceSelector: {}
    objectSelector: {}
    labels: {}
    existingPsp: ""
    networkPolicyEnabled: false
    service:
      annotations: {}
      externalIPs: []
      loadBalancerSourceRanges: []
      servicePort: 443
      type: ClusterIP
    createSecretJob:
      securityContext:
        allowPrivilegeEscalation: false
      resources: {}
    patchWebhookJob:
      securityContext:
        allowPrivilegeEscalation: false
      resources: {}
    patch:
      enabled: true
      image:
        registry: registry.cn-hangzhou.aliyuncs.com
        image: google_containers/kube-webhook-certgen
        tag: v20230312-helm-chart-4.5.2-28-g66a760794
        pullPolicy: IfNotPresent
      priorityClassName: ""
      podAnnotations: {}
      nodeSelector:
        kubernetes.io/os: linux
      tolerations: []
      labels: {}
      securityContext:
        runAsNonRoot: true
        runAsUser: 2000
        fsGroup: 2000
    certManager:
      enabled: false
      rootCert:
        duration: ""
      admissionCert:
        duration: ""
  metrics:
    port: 10254
    portName: metrics
    enabled: true
    service:
      annotations:
        prometheus.io/scrape: "true"
        prometheus.io/port: "10254"
      labels: {}
      externalIPs: []
      loadBalancerSourceRanges: []
      servicePort: 10254
      type: ClusterIP
    serviceMonitor:
      enabled: false
      additionalLabels: {}
      namespace: ""
      namespaceSelector: {}
      scrapeInterval: 30s
      targetLabels: []
      relabelings: []
      metricRelabelings: []
    prometheusRule:
      enabled: true
      additionalLabels: {}
      namespace: "monitoring"
      rules:
        - alert: NginxFailedReload
          expr: nginx_ingress_controller_config_last_reload_successful == 0
          for: 1m
          labels:
            severity: critical
          annotations:
            summary: "Nginx配置重载失败"
            description: "Nginx Ingress Controller配置重载失败,实例: {{ $labels.instance }}"

        - alert: HighHttp4xxRate
          expr: |
            sum(rate(nginx_ingress_controller_requests{status=~"4.."}[5m])) by (host, namespace)
            /
            sum(rate(nginx_ingress_controller_requests[5m])) by (host, namespace)
          for: 5m
          labels:
            severity: warning
          annotations:
            summary: "HTTP 4xx错误率过高 ({{ $value }}%)"
            description: "命名空间 {{ $labels.namespace }} 主机 {{ $labels.host }}"

        - alert: HighHttp5xxRate
          expr: |
            sum(rate(nginx_ingress_controller_requests{status=~"5.."}[5m])) by (host, namespace)
            /
            sum(rate(nginx_ingress_controller_requests[5m])) by (host, namespace)
            * 100 > 1
          for: 2m
          labels:
            severity: critical
          annotations:
            summary: "HTTP 5xx错误率过高 ({{ $value }}%)"
            description: "命名空间 {{ $labels.namespace }} 主机 {{ $labels.host }}"

        - alert: HighLatency
          expr: |
            histogram_quantile(0.99,
              sum by (le, host, namespace) (
                rate(nginx_ingress_controller_request_duration_seconds_bucket[2m])
              )
          for: 5m
          labels:
            severity: warning
          annotations:
            summary: "高延迟请求 (p99: {{ $value }}秒)"
            description: "命名空间 {{ $labels.namespace }} 主机 {{ $labels.host }}"

        - alert: HighRequestRate
          expr: |
          for: 5m
          labels:
            severity: warning
          annotations:
            summary: "高请求速率 ({{ $value }} req/s)"
            description: "实例 {{ $labels.instance }}"

        - alert: SSLCertExpiring15d
          expr: |
          for: 1h
          labels:
            severity: warning
          annotations:
            summary: "SSL证书即将过期 ({{ $labels.host }})"
            description: "证书 {{ $labels.secret_name }} 将在15天内过期 (剩余: {{ $value | humanizeDuration }})"

        - alert: SSLCertExpiring7d
          expr: |
          for: 1h
          labels:
            severity: critical
          annotations:
            summary: "SSL证书即将过期 ({{ $labels.host }})"
            description: "证书 {{ $labels.secret_name }} 将在7天内过期 (剩余: {{ $value | humanizeDuration }})"
  lifecycle:
    preStop:
      exec:
        command:
          - /wait-shutdown
  priorityClassName: ""
revisionHistoryLimit: 10
defaultBackend:
  enabled: false
  name: defaultbackend
  image:
    registry: registry.k8s.io
    image: defaultbackend-amd64
    tag: "1.5"
    pullPolicy: IfNotPresent
    runAsUser: 65534
    runAsNonRoot: true
    readOnlyRootFilesystem: true
    allowPrivilegeEscalation: false
  existingPsp: ""
  extraArgs: {}
  serviceAccount:
    create: true
    name: ""
    automountServiceAccountToken: true
  extraEnvs: []
  port: 8080
  livenessProbe:
    failureThreshold: 3
    initialDelaySeconds: 30
    periodSeconds: 10
    successThreshold: 1
    timeoutSeconds: 5
  readinessProbe:
    failureThreshold: 6
    initialDelaySeconds: 0
    periodSeconds: 5
    successThreshold: 1
    timeoutSeconds: 5
  updateStrategy: {}
  minReadySeconds: 0
  tolerations: []
  affinity: {}
  podSecurityContext: {}
  containerSecurityContext: {}
  podLabels: {}
  nodeSelector:
    kubernetes.io/os: linux
  podAnnotations: {}
  replicaCount: 1
  minAvailable: 1
  resources: {}
  extraVolumeMounts: []
  extraVolumes: []
  autoscaling:
    apiVersion: autoscaling/v2
    annotations: {}
    enabled: false
    minReplicas: 1
    maxReplicas: 2
    targetCPUUtilizationPercentage: 50
    targetMemoryUtilizationPercentage: 50
  service:
    annotations: {}
    externalIPs: []
    loadBalancerSourceRanges: []
    servicePort: 80
    type: ClusterIP
  priorityClassName: ""
  labels: {}
rbac:
  create: true
  scope: false
podSecurityPolicy:
  enabled: false
serviceAccount:
  create: true
  name: ""
  automountServiceAccountToken: true
  annotations: {}
imagePullSecrets: []
tcp: {}
udp: {}
portNamePrefix: ""
dhParam: ""
默认情况下nginx-ingress的监控指标端口为10254,监控路径为其下的/metrics。调整配置ingress-nginx的配置文件,打开service及pod的10254端口。
更新:
[root@master01 ~]# cd /root/6/
[root@master01 6]# helm upgrade ingress-nginx ./ingress-nginx -f ./ingress-nginx/values.yaml  -n ingress-nginx
查看验证指标数据:
[root@master01 7]# kubectl get ep -ningress-nginx
NAME                                 ENDPOINTS                                              AGE
ingress-nginx-controller             10.0.0.61:443,10.0.0.62:443,10.0.0.61:80 + 1 more...   6d9h
ingress-nginx-controller-admission   10.0.0.61:8443,10.0.0.62:8443                          6d9h
ingress-nginx-controller-metrics     10.0.0.61:10254,10.0.0.62:10254                        19m

[root@master01 7]# curl 10.0.0.61:10254/metrics
补充:课程添加的告警规则-参考
vim values.yaml
...
...
    prometheusRule:
      enabled: true
      additionalLabels: {}
      namespace: "monitoring"
      rules:
      - alert: NginxFailedtoLoadConfiguration
        expr: nginx_ingress_controller_config_last_reload_successful == 0
        for: 1m
        labels:
          severity: critical
        annotations:
          summary: "Nginx Ingress Controller配置文件加载失败"
          description: "Nginx Ingress Controller的配置文件加载失败,请检查配置文件是否正确。"
      - alert: NginxHighHttp4xxErrorRate
        expr: rate(nginx_ingress_controller_requests{status=~"^404"}[5m]) * 100 > 1
        for: 1m
        labels:
          severity: warining
        annotations:
          description: Nginx high HTTP 4xx error rate ( namespaces {{ $labels.exported_namespace }} host {{ $labels.host }} )
          summary: "Too many HTTP requests with status 404 (> 1%)"
      - alert: NginxHighHttp5xxErrorRate
        expr: rate(nginx_ingress_controller_requests{status=~"^5.."}[5m]) * 100 > 1
        for: 1m
        labels:
          severity: warining
        annotations:
          description: Nginx high HTTP 5xx error rate ( namespaces {{ $labels.exported_namespace }} host {{ $labels.host }} )
          summary: "Too many HTTP requests with status 5xx (> 1%)"
      - alert: NginxLatencyHigh
        expr: histogram_quantile(0.99, sum(rate(nginx_ingress_controller_request_duration_seconds_bucket[2m])) by (host, node)) > 3
        for: 2m
        labels:
          severity: warining
        annotations:
         description: Nginx latency high ( namespaces {{ $labels.exported_namespace }} host {{ $labels.host }} )
         summary: "Nginx p99 latency is higher than 3 seconds"
      - alert: NginxHighRequestRate
        expr: rate(nginx_ingress_controller_nginx_process_requests_total[5m]) * 100 > 1000
        for: 1m
        labels:
          severity: warning
        annotations:
          description: Nginx ingress controller high request rate ( instance {{ $labels.instance }} namespaces {{ $labels.namespaces }} pod {{$labels.pod}})
          summary: "Nginx ingress controller high request rate (> 1000 requests per second)"
      - alert: SSLCertificateExpiration15day
        expr: nginx_ingress_controller_ssl_expire_time_seconds < 1296000
        for: 30m
        labels:
          severity: warning
        annotations:
          summary: SSL/TLS certificate for {{ $labels.host $labels.secret_name }} is about to expire
          description: The SSL/TLS certificate for {{ $labels.host $labels.secret_name }} will expire in less than 15 days.
      - alert: SSLCertificateExpiration7day
        expr: nginx_ingress_controller_ssl_expire_time_seconds < 604800
        for: 30m
        labels:
          severity: critical
        annotations:
          summary: SSL/TLS certificate for {{ $labels.host $labels.secret_name }} is about to expire
          description: The SSL/TLS certificate for {{ $labels.host $labels.secret_name }} will expire in less than 7 days.
2.2 手动添加serviceMonitor
vim servicemonitor.yaml

apiVersion: monitoring.coreos.com/v1
kind: ServiceMonitor
metadata:
    name: ingress-nginx
    namespace: monitoring
spec:
  endpoints:
  - interval: 15s
    port: metrics
  namespaceSelector:
    matchNames:
    - ingress-nginx
  selector:
    matchLabels:
      app.kubernetes.io/component: controller
      app.kubernetes.io/instance: ingress-nginx
      app.kubernetes.io/name: ingress-nginx
      app.kubernetes.io/part-of: ingress-nginx
      app.kubernetes.io/version: 1.7.0
---
# 在对应的ns中创建角色
apiVersion: rbac.authorization.k8s.io/v1
kind: Role
metadata:
  name: prometheus-k8s
  namespace: ingress-nginx
rules:
- apiGroups:
  - ""
  resources:
  - services
  - endpoints
  - pods
  verbs:
  - get
  - list
  - watch
---
# 绑定角色 prometheus-k8s 角色到 Role
apiVersion: rbac.authorization.k8s.io/v1
kind: RoleBinding
metadata:
  name: prometheus-k8s
  namespace: ingress-nginx
roleRef:
  apiGroup: rbac.authorization.k8s.io
  kind: Role
  name: prometheus-k8s
subjects:
- kind: ServiceAccount
  name: prometheus-k8s #Prometheus容器使用的 serviceAccount,kube-prometheus默认使用prometheus-k8s这个用户
  namespace: monitoring

# 应用
kaf servicemonitor.yaml
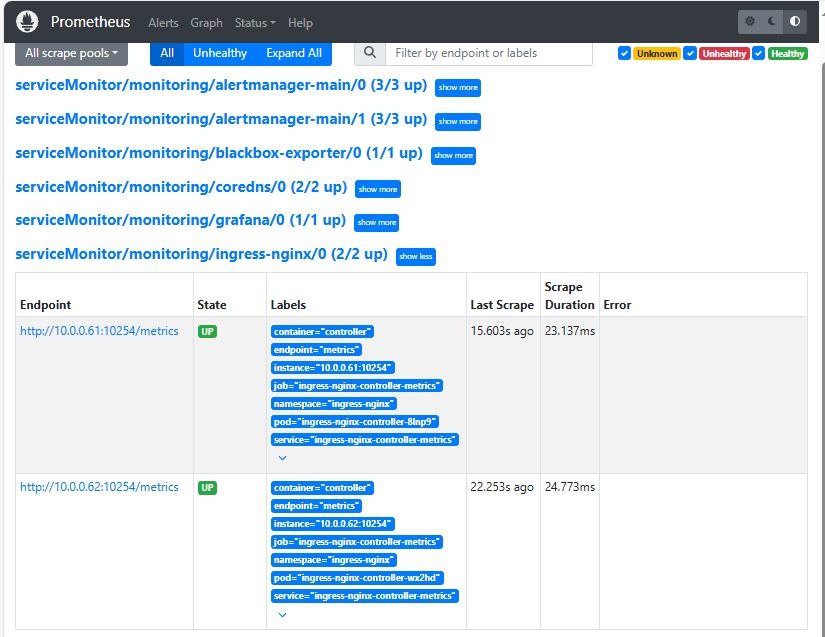
验证:
[root@master01 7]#  kg servicemonitor -nmonitoring | grep ingress
ingress-nginx             23s
登录http://prometheus-opera.zhang-qing.com/通过 webUI 去验证prometheus 的rules/target 是否ok;