

一、抓取自定义资源 -- 常规部署的Ingress-nginx
1.1 修改Ingress Service
apiVersion: v1
kind: Service
metadata:
 annotations:
   prometheus.io/scrape: "true"
   prometheus.io/port: "10254"
...
spec:
  ports:
  - name: prometheus
    port: 10254
    targetPort: 10254
...

修改完成最终效果:
apiVersion: v1
kind: Service
metadata:
  annotations:
    prometheus.io/port: "10254"
    prometheus.io/scrape: "true"
  labels:
    app.kubernetes.io/component: controller
    app.kubernetes.io/instance: ingress-nginx
    app.kubernetes.io/name: ingress-nginx
    app.kubernetes.io/part-of: ingress-nginx
    app.kubernetes.io/version: 1.3.1
  name: ingress-nginx-controller
  namespace: ingress-nginx
spec:
  ipFamilies:
  - IPv4
  ipFamilyPolicy: SingleStack
  ports:
  - appProtocol: http
    name: http
    port: 80
    protocol: TCP
    targetPort: http
  - appProtocol: https
    name: https
    port: 443
    protocol: TCP
    targetPort: https
  - name: prometheus
    port: 10254
    targetPort: 10254
  selector:
    app.kubernetes.io/component: controller
    app.kubernetes.io/instance: ingress-nginx
    app.kubernetes.io/name: ingress-nginx
  type: ClusterIP
1.2 修改Ingress deployment
vim ingress-deploy.yml
apiVersion: v1
kind: Deployment
metadata:
  annotations:
    prometheus.io/scrape: "true"
    prometheus.io/port: "10254"
..
spec:
  ports:
    - name: prometheus
      containerPort: 10254
      ..

## 重新apply一下yaml文件让修改的配置生效
$ kubectl apply -f ingress-deploy.yml
1.3 测试验证
$ kubectl get po,svc -n ingress-nginx
NAME                                 READY   STATUS    RESTARTS   AGE
pod/ingress-nginx-controller-8mf4l   1/1     Running   0          20m
pod/ingress-nginx-controller-rqh9l   1/1     Running   0          21m

NAME                                         TYPE           CLUSTER-IP       EXTERNAL-IP      PORT(S)                      AGE
service/ingress-nginx-controller             LoadBalancer   10.107.128.117   192.10.192.223   80:32333/TCP,443:31050/TCP   34d
service/ingress-nginx-controller-admission   ClusterIP      10.106.77.73     <none>           443/TCP                      34d
service/ingress-nginx-controller-metrics     ClusterIP      10.105.151.145   <none>           10254/TCP                    21m

$ curl 127.0.0.1:10254/metrics      # 在Ingress的节点上运行一下看看是否可以获取到资源
# HELP go_gc_duration_seconds A summary of the pause duration of garbage collection cycles.
# TYPE go_gc_duration_seconds summary
go_gc_duration_seconds{quantile="0"} 2.4853e-05
go_gc_duration_seconds{quantile="0.25"} 5.7798e-05
go_gc_duration_seconds{quantile="0.5"} 7.5043e-05
go_gc_duration_seconds{quantile="0.75"} 9.8753e-05
go_gc_duration_seconds{quantile="1"} 0.001074475
go_gc_duration_seconds_sum 0.010298983
go_gc_duration_seconds_count 104
# HELP go_goroutines Number of goroutines that currently exist.
# TYPE go_goroutines gauge
go_goroutines 100
# HELP go_info Information about the Go environment.
# TYPE go_info gauge
go_info{version="go1.18.2"} 1
# HELP go_memstats_alloc_bytes Number of bytes allocated and still in use.
# TYPE go_memstats_alloc_bytes gauge
go_memstats_alloc_bytes 1.2434328e+07
# HELP go_memstats_alloc_bytes_total Total number of bytes allocated, even if freed.
# TYPE go_memstats_alloc_bytes_total counter
go_memstats_alloc_bytes_total 8.21745944e+08
1.4 新增Ingress ServiceMonitor
apiVersion: monitoring.coreos.com/v1
kind: ServiceMonitor
metadata:
    name: ingress-nginx
    namespace: monitoring
spec:
  endpoints:
  - interval: 15s
    port: prometheus
  namespaceSelector:
    matchNames:
    - ingress-nginx
  selector:
    matchLabels:
      app.kubernetes.io/component: controller
      app.kubernetes.io/instance: ingress-nginx
      app.kubernetes.io/name: ingress-nginx
      app.kubernetes.io/part-of: ingress-nginx
      app.kubernetes.io/version: 1.7.0
---
# 在对应的ns中创建角色
apiVersion: rbac.authorization.k8s.io/v1
kind: Role
metadata:
  name: prometheus-k8s
  namespace: ingress-nginx
rules:
- apiGroups:
  - ""
  resources:
  - services
  - endpoints
  - pods
  verbs:
  - get
  - list
  - watch
---
# 绑定角色 prometheus-k8s 角色到 Role
apiVersion: rbac.authorization.k8s.io/v1
kind: RoleBinding
metadata:
  name: prometheus-k8s
  namespace: ingress-nginx
roleRef:
  apiGroup: rbac.authorization.k8s.io
  kind: Role
  name: prometheus-k8s
subjects:
- kind: ServiceAccount
  name: prometheus-k8s # Prometheus 容器使用的 serviceAccount,kube-prometheus默认使用prometheus-k8s这个用户
  namespace: monitoring
1.5 添加报警规则
apiVersion: monitoring.coreos.com/v1
kind: PrometheusRule
metadata:
  labels:
    prometheus: k8s
    role: alert-rules
  name: nginx-ingress-rules
  namespace: monitoring
spec:
  groups:
  - name: nginx-ingress-rules
    rules:
    - alert: NginxFailedtoLoadConfiguration
      expr: nginx_ingress_controller_config_last_reload_successful == 0
      for: 1m
      labels:
        severity: critical
      annotations:
        summary: "Nginx Ingress Controller配置文件加载失败"
        description: "Nginx Ingress Controller的配置文件加载失败,请检查配置文件是否正确。"
    - alert: NginxHighHttp4xxErrorRate
      expr: rate(nginx_ingress_controller_requests{status=~"^404"}[5m]) * 100 > 1
      for: 1m
      labels:
        severity: warining
      annotations:
        description: Nginx high HTTP 4xx error rate ( namespaces {{ $labels.exported_namespace }} host {{ $labels.host }} )
        summary: "Too many HTTP requests with status 404 (> 1%)"
    - alert: NginxHighHttp5xxErrorRate
      expr: rate(nginx_ingress_controller_requests{status=~"^5.."}[5m]) * 100 > 1
      for: 1m
      labels:
        severity: warining
      annotations:
        description: Nginx high HTTP 5xx error rate ( namespaces {{ $labels.exported_namespace }} host {{ $labels.host }} )
        summary: "Too many HTTP requests with status 5xx (> 1%)"
    - alert: NginxLatencyHigh
      expr: histogram_quantile(0.99, sum(rate(nginx_ingress_controller_request_duration_seconds_bucket[2m])) by (host, node)) > 3
      for: 2m
      labels:
        severity: warining
      annotations:
       description: Nginx latency high ( namespaces {{ $labels.exported_namespace }} host {{ $labels.host }} )
       summary: "Nginx p99 latency is higher than 3 seconds"
    - alert: NginxHighRequestRate
      expr: rate(nginx_ingress_controller_nginx_process_requests_total[5m]) * 100 > 1000
      for: 1m
      labels:
        severity: warning
      annotations:
        description: Nginx ingress controller high request rate ( instance {{ $labels.instance }} namespaces {{ $labels.namespaces }} pod {{$labels.pod}})
        summary: "Nginx ingress controller high request rate (> 1000 requests per second)"
    - alert: SSLCertificateExpiration15day
      expr: nginx_ingress_controller_ssl_expire_time_seconds < 1296000
      for: 30m
      labels:
        severity: warning
      annotations:
        summary: SSL/TLS certificate for {{ $labels.host $labels.secret_name }} is about to expire
        description: The SSL/TLS certificate for {{ $labels.host $labels.secret_name }} will expire in less than 15 days.
    - alert: SSLCertificateExpiration7day
      expr: nginx_ingress_controller_ssl_expire_time_seconds < 604800
      for: 30m
      labels:
        severity: critical
      annotations:
        summary: SSL/TLS certificate for {{ $labels.host $labels.secret_name }} is about to expire
        description: The SSL/TLS certificate for {{ $labels.host $labels.secret_name }} will expire in less than 7 days.
二、导入Grafana模板
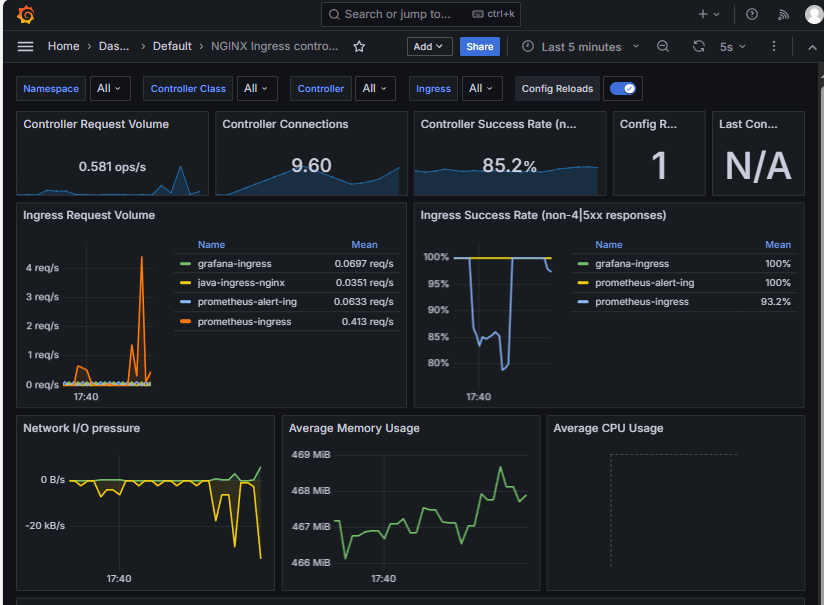
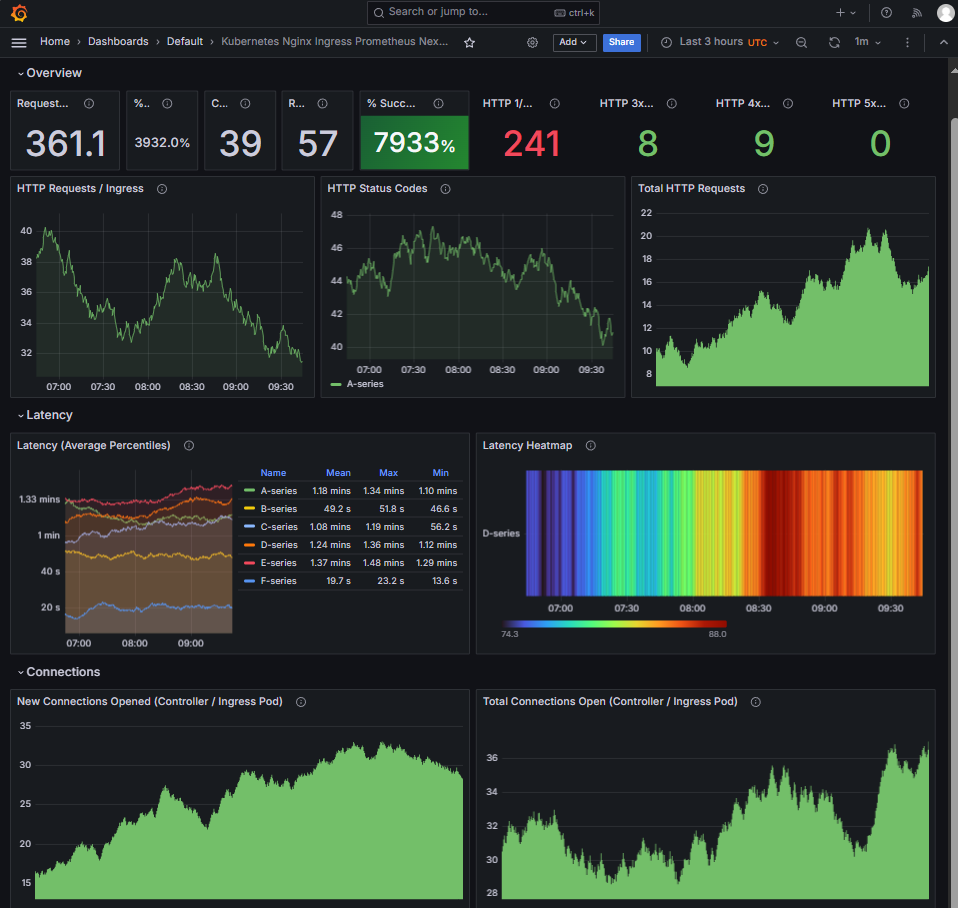
Ingress-nginx 模板ID:9614、14314
9614模板展示图
14314模板展示图
三、总结
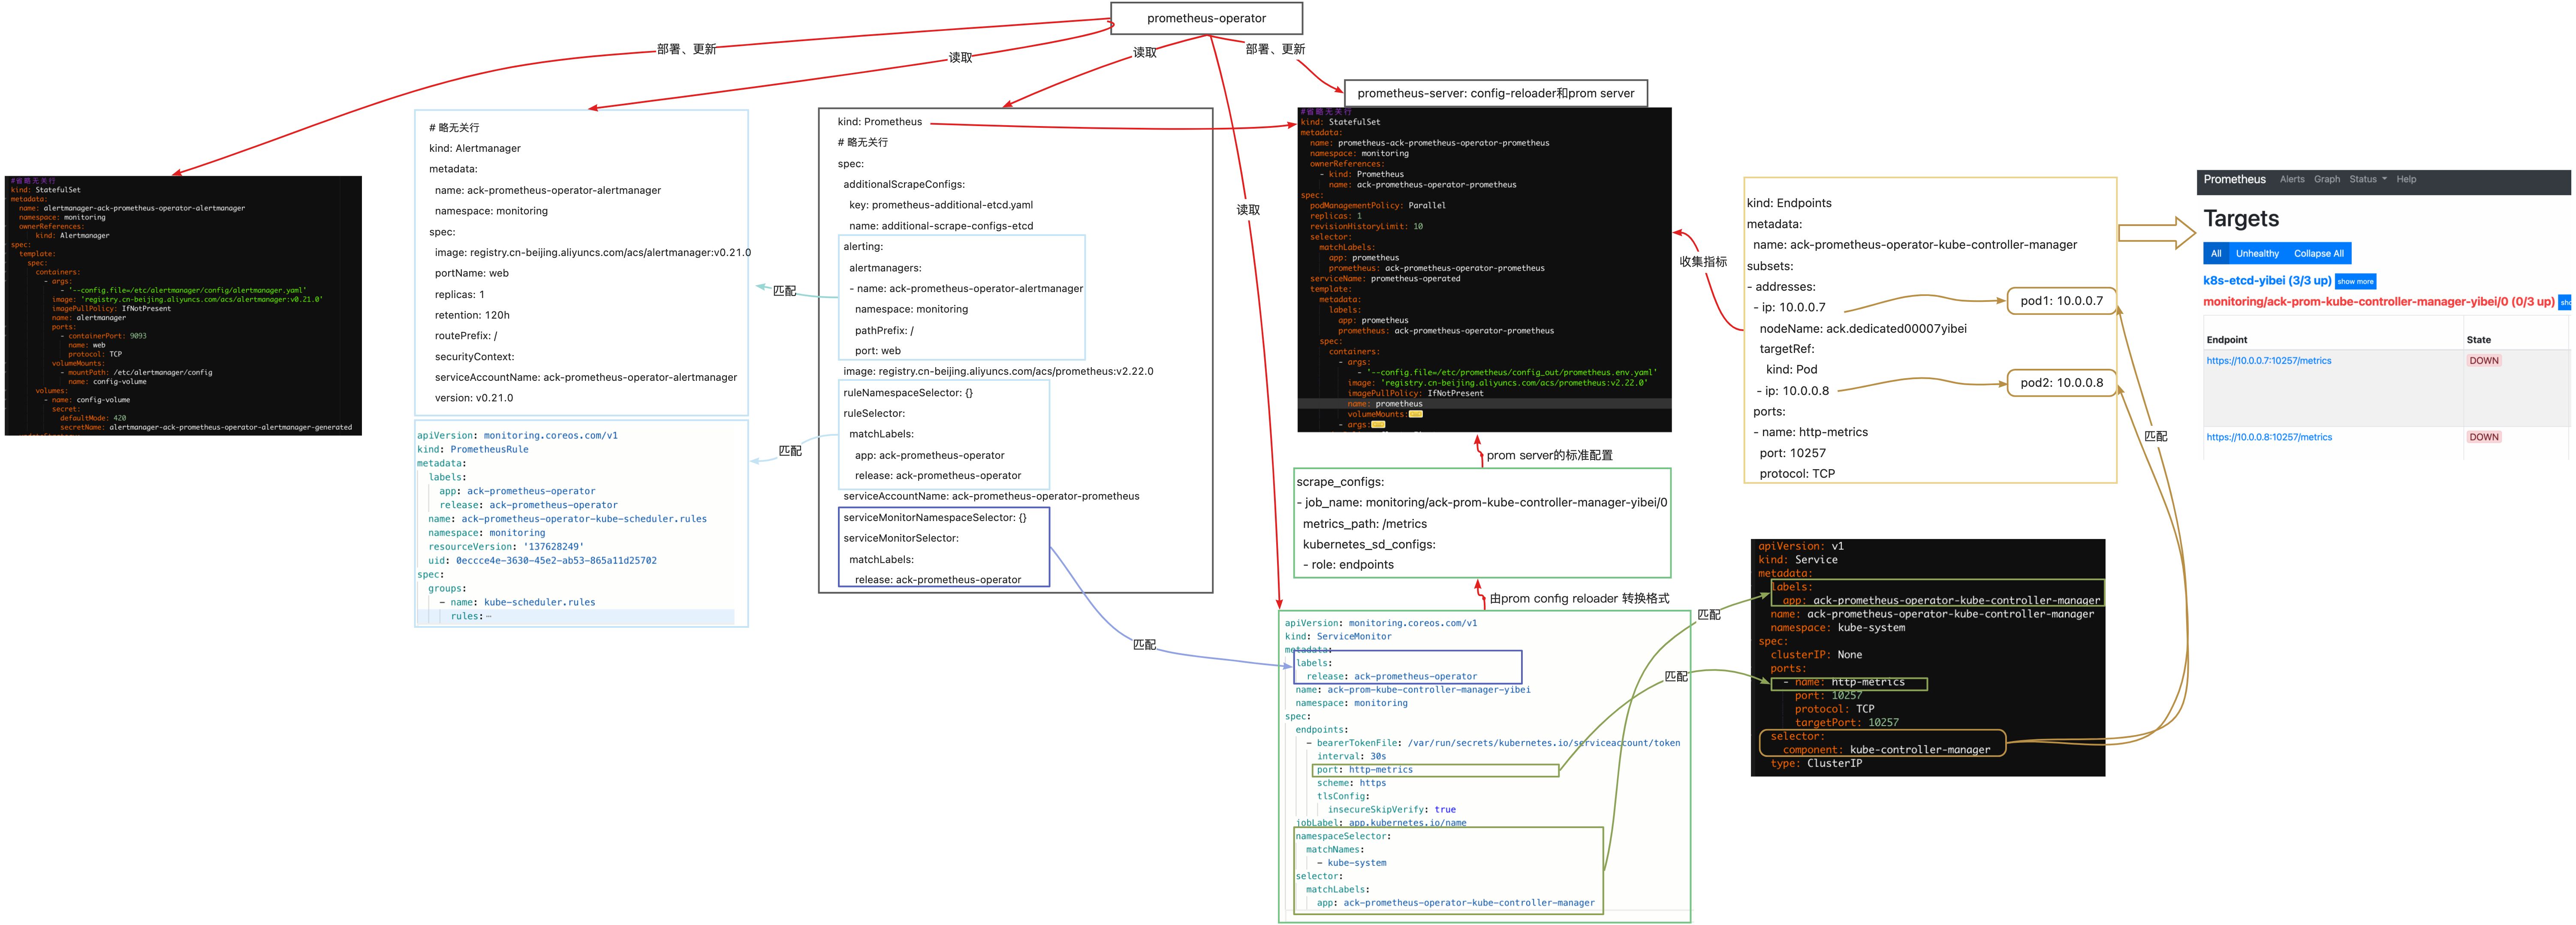
- Kube-prometheus 是一个用于在Kubernetes上运行Prometheus的开源项目;
- 它利用了Kubernetes的自定义资源定义(Custom Resource Definitions,CRD) 机制来定义和管理Prometheus实例;
- 在Prometheus Operator中,Prometheus实例、ServiceMonitor、 Alertmanager、PrometheusRule等都是自定义资源;
- 通过Prometheus Operator来自动化地管理和更新Prometheus实例的配置;
- 通过Kubernetes的CRD来管理Prometheus实例,而无需手动管理和维护 Prometheus的配置文件。
原图下载:https://xmars-devops.oss-cn-shanghai.aliyuncs.com/AliCloud/shili-1514f 254b1a9.jpeg
